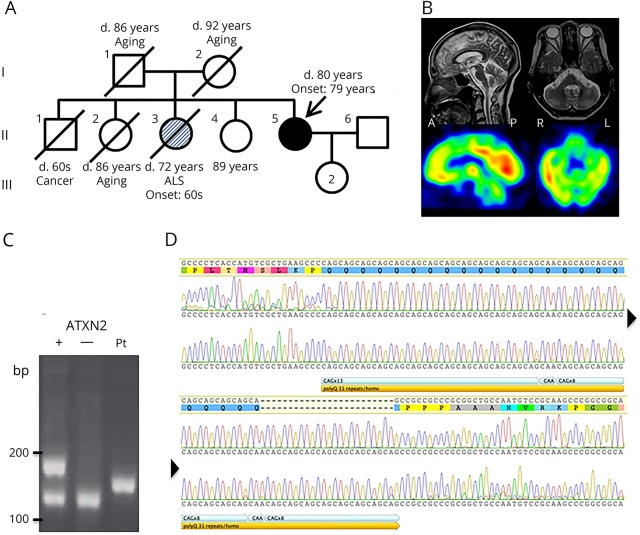
Figure. Pedigree, neuroimaging, and gene analysis.
(A) Family pedigree. (B) Upper. MRI showing atrophy of the cerebellar hemispheres. Lower. N-isopropyl-p-(iodine-123)-iodoamphetamine SPECT showing hypoperfusion in the brainstem and cerebellar hemispheres. (C) Analysis of PCR-amplified products containing CAG repeats in ATXN2. Plus (+) and minus (−) indicate positive and negative controls, respectively. Pt indicates sample from the present index case. (D) DNA sequence analysis of CAG repeats in ATXN2 of the present index case. Arrowheads indicate continuation. Chromatograms in both directions are shown. That in the upper portion is sequence analysis in the 3′ > 5′ direction, while that in the lower portion is the opposite, demonstrating homozygous (CAG)13CAA(CAG)8CAA(CAG)8. ALS = amyotrophic lateral sclerosis.

