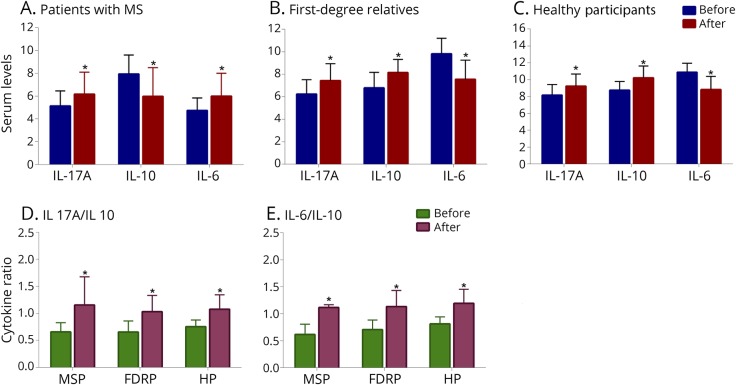
Figure 3. Within-group comparisons (before–after).
Effects of vitamin D3 on serum levels of proinflammatory and anti-inflammatory markers (n = 25 per group) (A–C) and the ratio of pro-to anti-inflammatory cytokines (D and E). IL-6, IL-17A, and IL-10 mRNA expression levels of healthy participants, patients with MS, and first-degree relatives. Paired t test analysis was used. Data were expressed as mean ± SD. *p < 0.05 was regarded as statistically significant.

