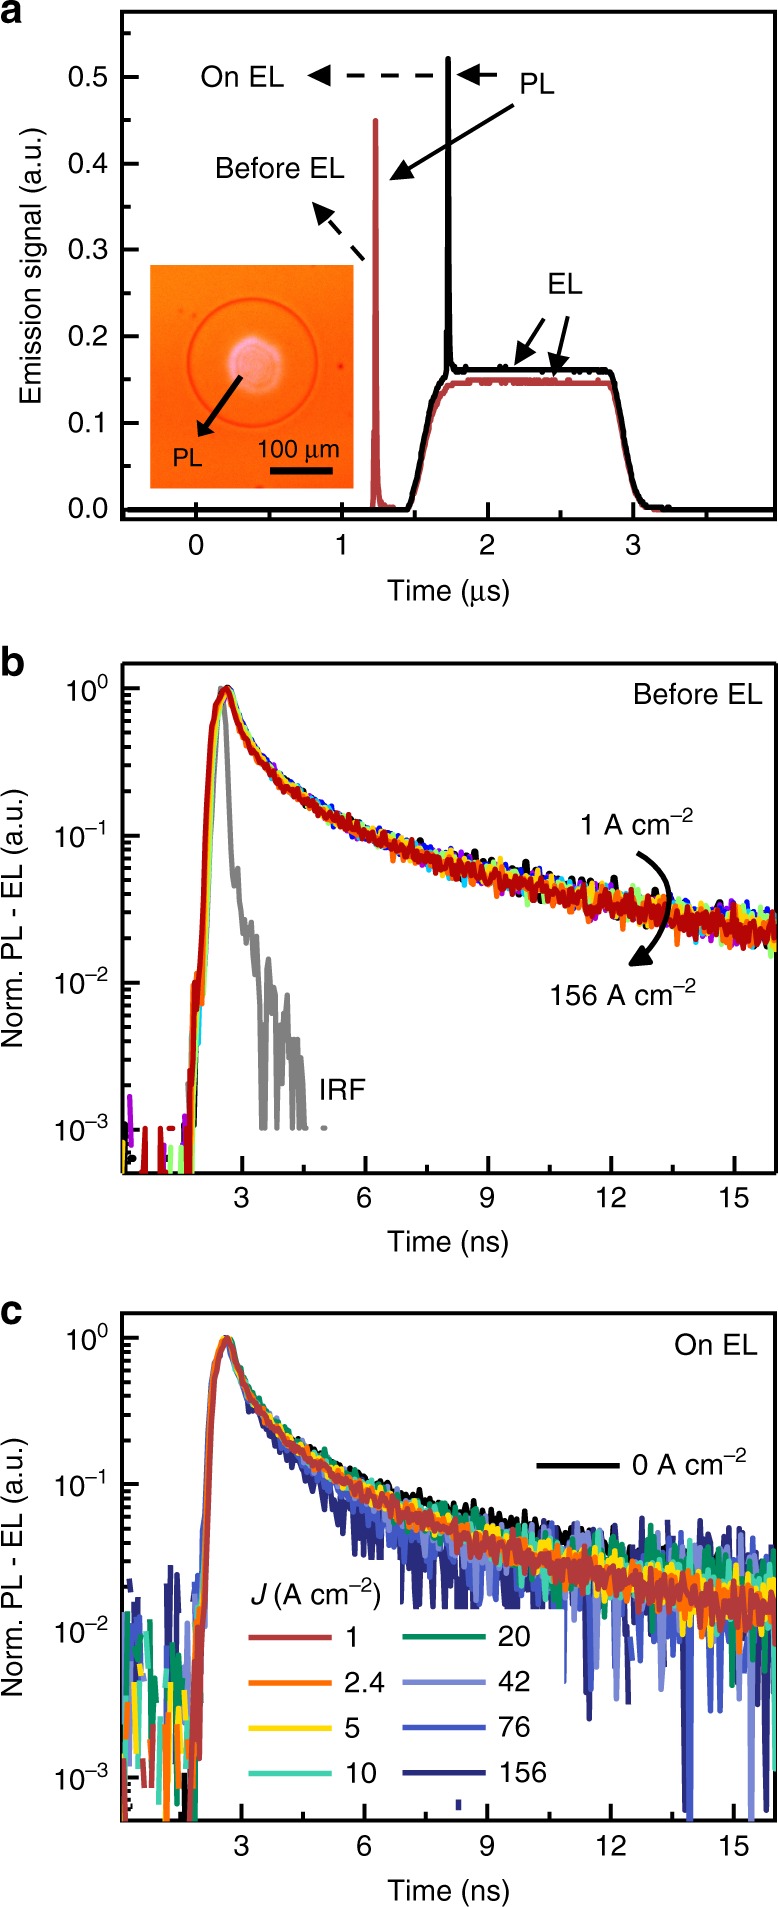
Fig. 8.

Relevance of Auger quenching. a Aggregate emission signal resulting from a 20 ps optical excitation pulse (λ = 355 nm, 10.7 µJ cm−2 fluence) incident on an LED just before (red line) and just after the start of a 1.5 µs, 45 A cm−2 electroluminescence pulse. The inset shows the overlap of the optical pump spot with the device area. The photoluminescence decay remains unchanged as a function of current density in both the before (b) and after (c) timing configurations up to the limit of 156 A cm−2 reached in this experiment. Note that the faster overall decay of the photoluminescence transients here as compared to Fig. 3 results from the higher pump fluence used in this case. The instrument response function (IRF) is shown by the gray line with a temporal resolution of 0.2 ns
