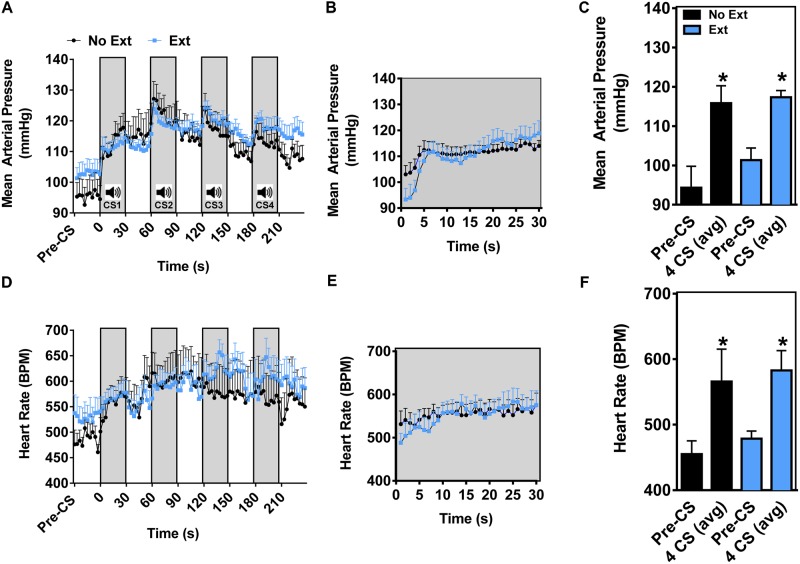
FIGURE 3.
Pre-extinction training CS-dependent cardiovascular response test 1 (home cage). Mean arterial pressure (A), and heart rate (D) collected during 4 CS presentations and averaged every 3 s. (B,E) Depict second-by-second fluctuations in MAP and HR during the first CS presentation. Average MAP (C) and HR (F) during the 5 min pre-CS period, and over 4 CS presentations (n = 6–9 per group, ∗p < 0.05 pre-CS vs. 4 CS avg).

