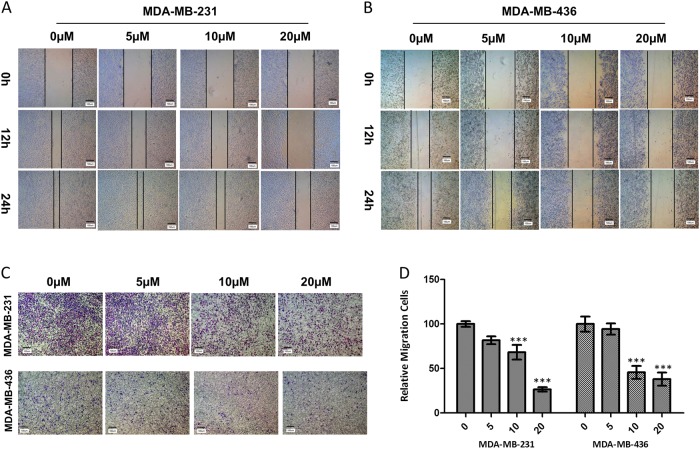
Fig. 2. Apigenin attenuated migration of TNBC cells.
a, b Representative images from the wound-healing assay of MDA-MB-231 and MDA-MB-436 cells are displayed for 12 and 24 h. c Representative images of the transwell migration assay are shown for 24 h after cells seeding. d Statistical analysis of relative migrating cell numbers. The results shown are representative of at least three independent experiments. Data are shown as the means ± S.D. (**P < 0.01 and ***P < 0.001 compared with the control group)

