Figure 10.
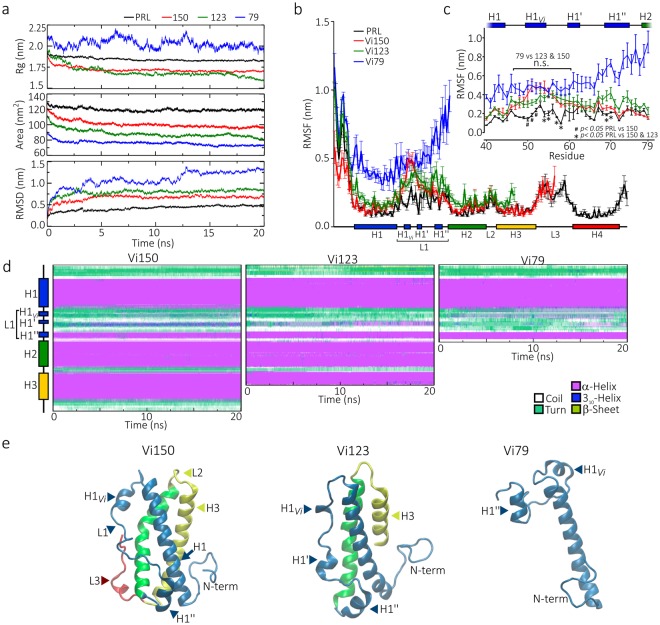
Comparison of the molecular dynamic simulation (MD) of the 150, 123, and 79 amino acid vasoinhibins. (a) Trajectory analysis of PRL and vasoinhibins of 150, 123 and 79 amino acids (Vi150, Vi123, and Vi79, respectively) during 20 ns of MD simulation. Average radius of gyration (Rg), surface area, and root mean square deviation (RMSD) of three MD simulations per molecule. (b) Mean ± SEM root mean square fluctuation (RMSF) per residue of three independent MD simulations. (c) RMSF values in the L1 region. Values of each PRL residue are statistically different (p < 0.05) from both Vi150 and Vi123 (*), or only from Vi150 (#) as indicated. The horizontal bracket indicates the region of L1 in which all three vasoinhibins display similar RMSF values (residues 47 to 60). (d) Dynamic changes of the secondary structure profile per residue of Vi150, Vi123, and Vi79 throughout 20 ns of MD simulation. Average composition of at least 3 independent MD simulations. (e) Representative structures of Vi150, Vi123, and Vi79 at the end of the 20 ns MD simulation. Structural motifs are indicated.

