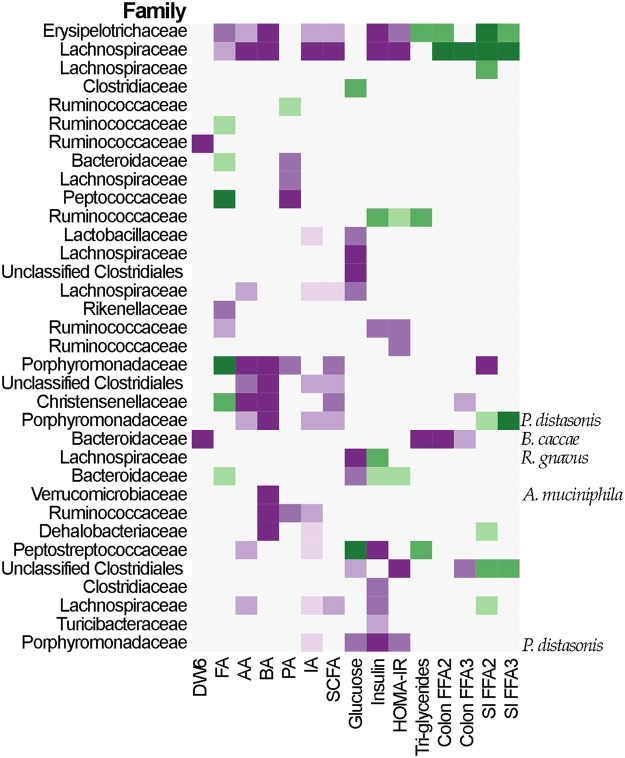
Figure 7.
Changes in sequences abundances as a function of different physiological and biochemical variables. GLM include country and weight change as covariance (except for week 6, p-value ≤ 0.01). FA, formic acid; AA, acetic acid; PA, propionic acid; BA, butyric acid; IA, isovaleric acid; SCFA, total concentration of SCFAs; SI, small intestine; DW6, difference in weight after 6 weeks compared with the mice initial weight. Purple colors indicate negative associations; green colors indicate positive associations.

