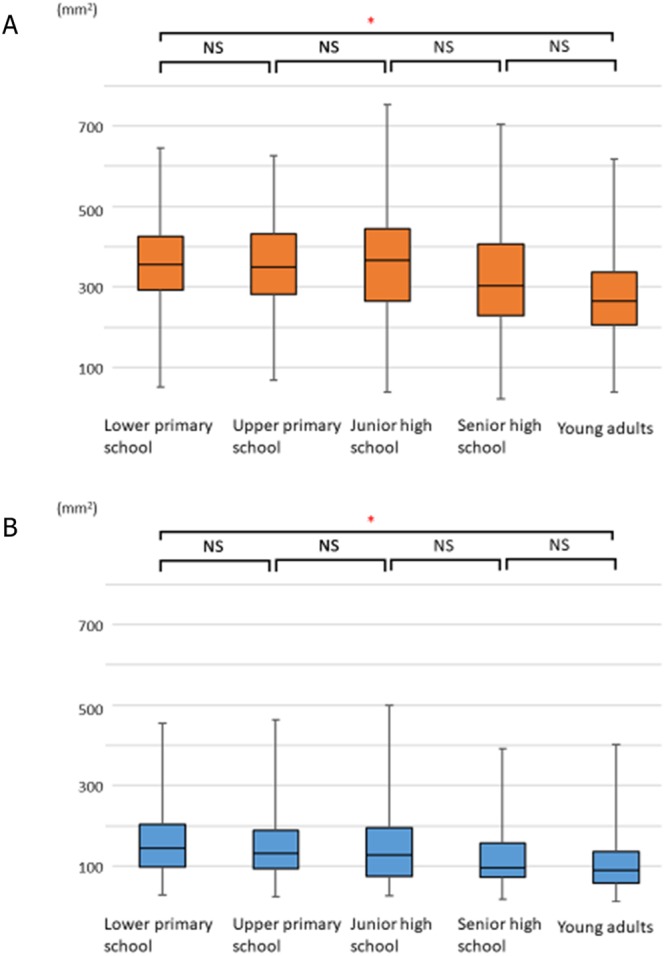
Figure 3.

Age-dependent changes in the adenoids (Ad) and tonsils (Tn). Error bars denote 95% confidence interval determined by bootstrap analysis of 1000 iterations. (A) Age-dependent changes in the adenoids (Ad). A comparison of the Ad among the age groups revealed no significant changes. (347.55 ± 12.52, 346.22 ± 12.63, 355.41 ± 14.51, 316.62 ± 14.38, and 274.48 ± 13.03 mm2 in the lower primary school, upper primary school, junior high school, senior high school, and young adult groups, respectively). (B) Age-dependent changes in the tonsils (Tn). A comparison of the Tn among the age groups revealed no significant changes. (161.34 ± 9.54, 152.82 ± 9.35, 145.46 ± 9.59, 127.64 ± 8.48, 110.97 ± 8.19 mm2 in the lower primary school, upper primary school, junior high school, senior high school, and young adult groups, respectively).
