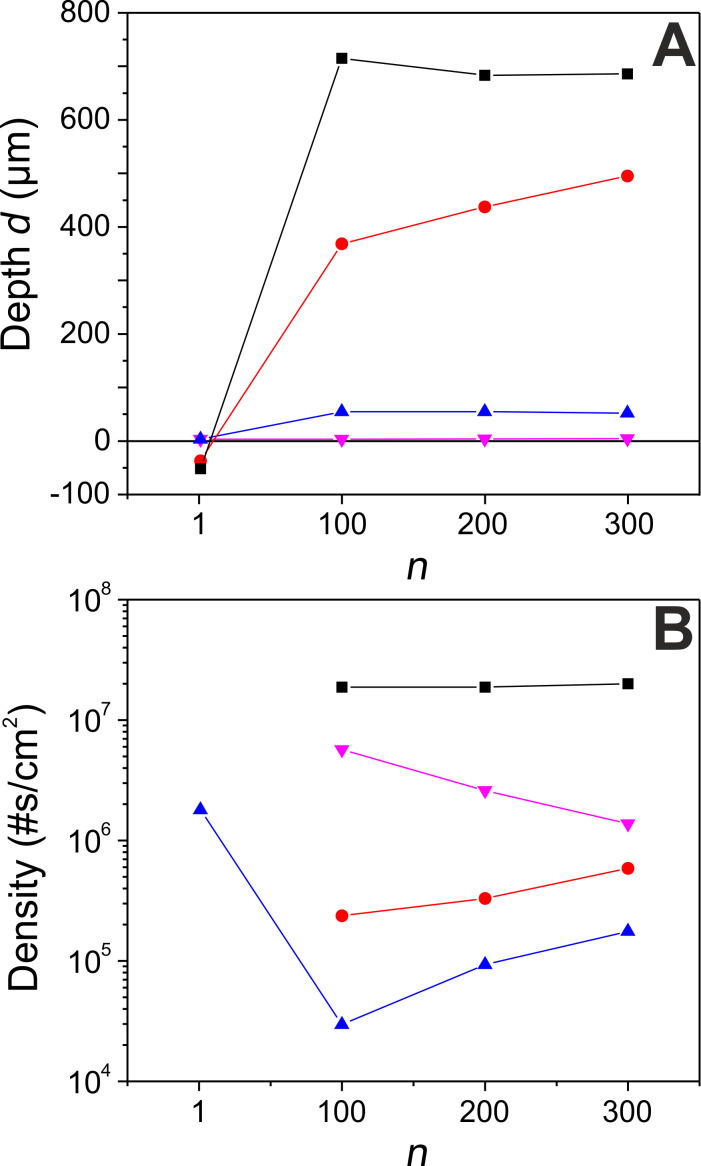
Figure 3.
Evolution of the depth d of the structured fields (A), and the density of structural units (B) produced vs the number of rescans, n. The different curves correspond to different experimental conditions, as indicated in Table 1. The plotted fluences are 0.12 (pink triangle), 0.2 (blue triangle), 0.5 (red circle) and 1 J/cm2 (black square).

