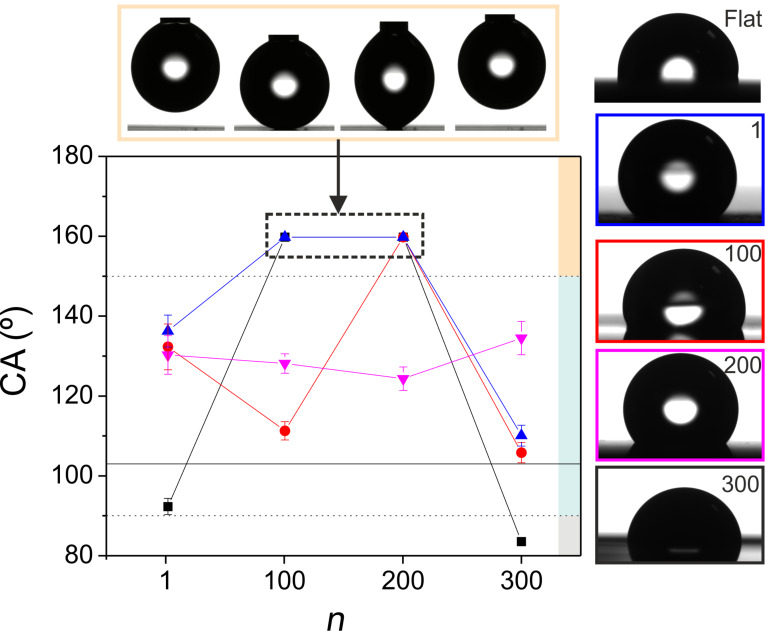
Figure 4.
Side view of water droplets placed on different laser-processed areas. The labels/frame color of the right column of micrographs indicate the specific scan number and fluence used. The experimental conditions for each case are available in Table 1. The plot shows the evolution of the contact angle (CA) as a function of scan number n. The plotted fluences are 0.12 (pink triangle), 0.2 (blue triangle), 0.5 (red circle) and 1 J/cm2 (black square). Points plotted with CA values above 150° correspond to superhydrophobic surfaces that did not allow the positioning of the droplet (no CA could be measured in those cases). The top row of micrograph illustrates a time sequence of such a case, summarized in four stages: approaching, contact, attempt to retrieve the syringe, unwanted removal of the drop. A video is included as Supporting Information File 1 where can be seen that after several attempts the water droplet does not land on the laser irradiated surface. A color code is included at the right part of the plot in order to distinguish between surfaces with different wetting behaviors. Superhydrophobic surfaces in yellow (CA > 150°), hydrophobic surfaces in blue (150° > CA > 90°) and hydrophilic surfaces in grey (90° > CA > 10°). The CA of untreated steel is 103° indicated by a solid line.

