Fig. 3.
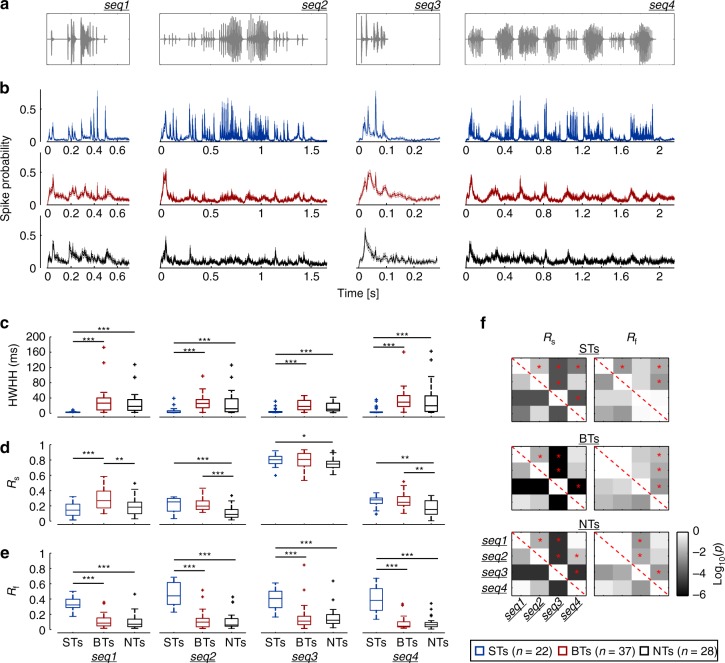
Population response properties across calls. a Oscillogram of the natural distress calls used as stimuli. b Average population responses of ST (blue), BT (red), and NT (black) units in response to the distress sequences (shown as spike probability density function over time, 1 ms precision; thick line depicts the mean, whereas thinner lines represent the SEM). c Neuronal precision (measured as HWHH, see main text) of the three subpopulations in response to the natural stimuli (from seq1 to seq4, left to right). Syllable-tracking units were always significantly more precise than BT and NT units (FDR-corrected Wilcoxon rank-sum tests, pcorr ≤ 0.0013), but no significant differences occurred between BTs and NTs in any of the calls tested (pcorr > 0.08). d Comparison of vector strength from the spike phases relative to the slow (0.1–15 Hz) call envelopes (Rs). Across sequences and according to their Rs value, NT units were significantly less synchronized than BT units (pcorr ≤ 0.02; except in the shortest call, seq3). e Comparison of vector strength from spike phases relative to the fast (50–100 Hz) call envelope (Rf). ST units were always better synchronized to the fast temporal structure of the sequences (pcorr < 2.2 × 10⁻⁶), while no differences occurred between BT or NT units (pcorr > 0.45). f Significance matrix of statistical comparisons (Wilcoxon signed-rank test, FDR corrected) between vector strength values (Rs, left column; Rf right column) across calls, for each neuronal type (STs, BTs, or NTs, indicated in the figure). Each cell (i,j) in a matrix shows the corrected p-value obtained by comparing the R value of each group in response to two different sequences, seq(i) and seq(j). For example, the red star in cell (1,2) of the upper left matrix indicates that when considering the Rs of ST units, there were significant differences between responses elicited by seq1 and seq2. Note that these matrixes are symmetrical along the diagonal (red dashed line) (*pcorr < 0.05; **pcorr < 0.01; ***pcorr < 0.001)

