Fig. 4.
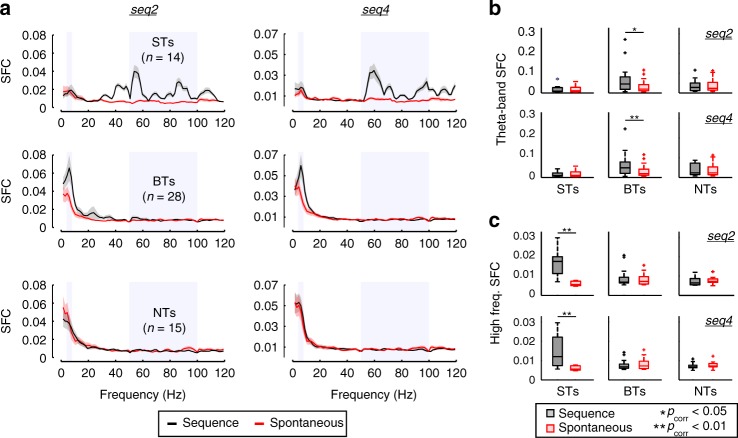
Spike–LFP coherence patterns are group specific. a Population spike–field coherence (SFC) for ST (top), BT (middle), and NT (bottom) units, in response to calls seq2 (left column) and seq4 (right; i.e. the two longest calls in this study). Vertical shaded areas indicate frequency bands of 4–8 and 50–100 Hz (that is, theta-band and high- frequency band of the LFP, respectively). Black traces indicate coherence calculated with spikes and LFPs recorded during sound stimulation, whereas red traces show coherence during spontaneous activity (solid lines, mean; shaded areas, SEM). b Comparison of average theta-band SFC in response to both sequences (top, seq2; bottom, seq4). Only BTs significantly increased their theta-band spike–LFP synchrony during stimulation as compared to spontaneous coherence (FDR-corrected Wilcoxon signed-rank tests, pcorr ≤ 0.03 in the case of BT units). c Same as in b but considering SFC in high frequencies (50–100 Hz). Only ST units significantly increased their high-frequency spike–LFP coherence during acoustic stimulation, in response to either sequence (pcorr ≤ 0.0024). (*pcorr < 0.05; **pcorr < 0.01)

