Fig. 6.
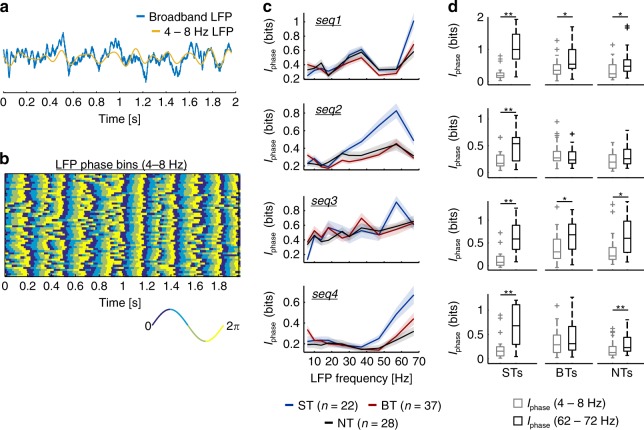
Information content of LFP phase. a Single trial broadband (blue) and theta-band (4–8 Hz; yellow) LFP traces. Depicted field potentials were recorded in response to seq4 and correspond to the same exemplary BT unit shown in Fig. 2c. b Binned LFP phase across trials of theta-band LFPs, according to the phase discretization used to calculate Iphase. The convention for the bins is shown at the bottom (note that the binning precision was of π/2). c Information content of the LFP phase (Iphase) associated to ST (blue), BT (red), and NT (black) units, in different frequency bands and across all sequences tested. Data is presented as mean (solid lines) ± SEM (shaded areas). d Statistical comparisons (FDR-corrected Wilcoxon signed-rank test) of Iphase in theta-band LFPs (light gray) vs. Iphase in high-frequency LFPs (62–72 Hz; black). Each row depicts comparisons for a particular call, considering ST, BT, or NT units (arranged in columns left to right, respectively). (*pcorr < 0.05; **pcorr < 0.01)

