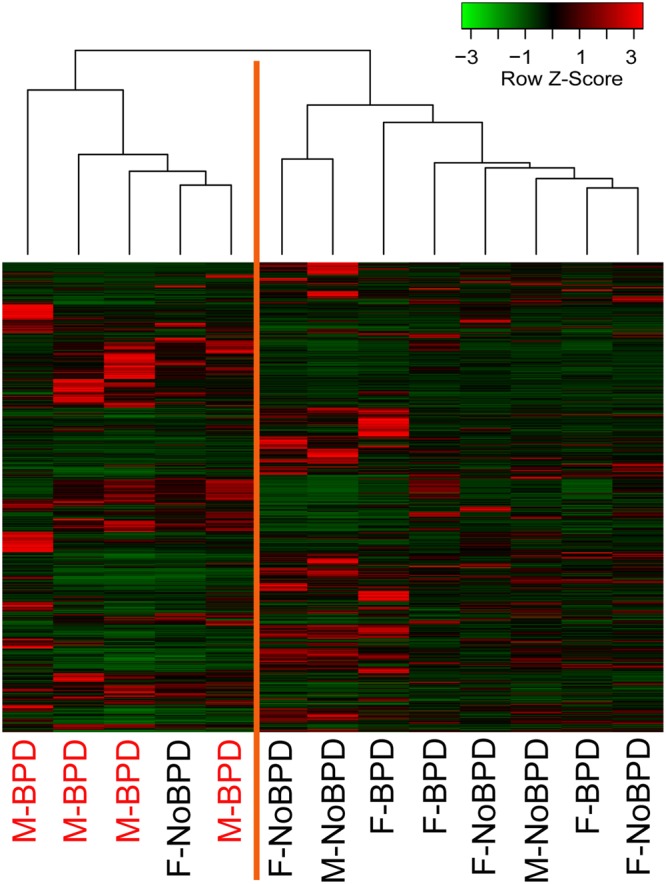
Figure 1.

Neonatal lung MSCs expression profiles. Heatmap of unsupervised hierarchical cluster analysis of neonatal lung MSCs expression data based on 870 genes, selected after filtering out genes with low expression levels and low variance. The discovery cohort included 13 infants. Each column represents a sample and each row represents a gene. The Z-score depicts the expression level as a measure of distance, in standard deviations, away from the mean expression of a given gene across all samples. The relative expression value for each gene is depicted by color intensity, with red indicating upregulated and green indicating downregulated genes.
