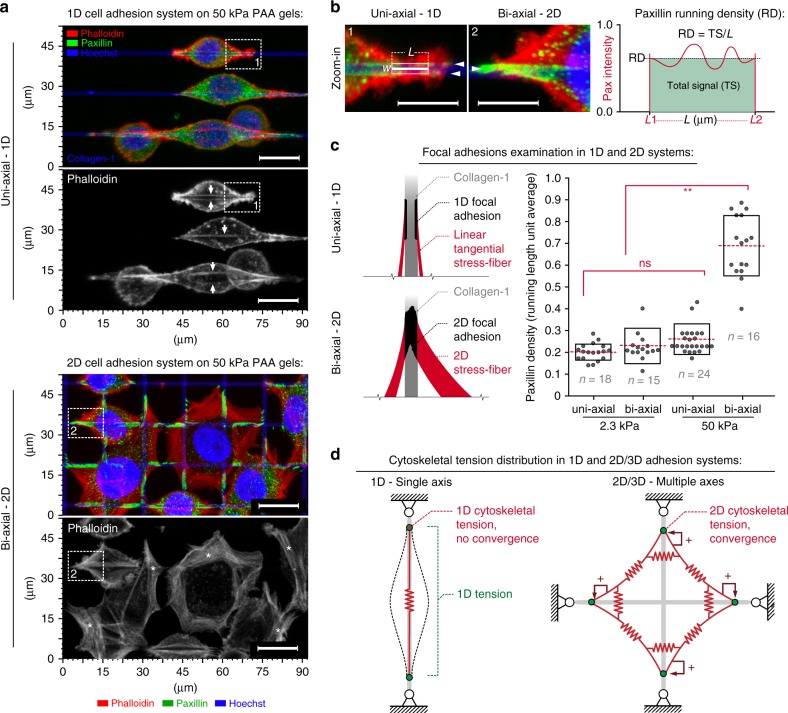
Fig. 3.
Cell adhesion and mechanical responses to distinct guidance cue dimensionality and rigidity. a Fluorescence 3D reconstruction micrographs of F-actin (phalloidin—red), FAs (paxillin—green), and nuclei (Hoechst—blue) on stiff uniaxial and biaxial platforms reveal a more robust development of the FA and stress-fiber contractile apparatus in response to biaxial cues versus 1D cues. White arrows (top panel) highlight actin fibers. Boxes 1 and 2 are zoomed-in regions shown in b. b Zoomed-in apical regions shown in a. Arrowheads highlight prominent FA development homogeneously filling the line in response to biaxial cues (2) while paxillin distribution for uniaxial cues is more localized at the line edges (1). To capture differences in FAs, we employ a metric of running length density. Paxillin running density is an “intensive” parameter that reflects the total paxillin signal per micron of length along collagen guidance cue axes to characterizes the build-up of FAs in terms of structural density, maturity, and level of integration with contractile stress-fibers (see right panel). c Schematic representation of the observed FA and corresponding stress-fiber architectures for cells encountering uniaxial or biaxial cues and quantification of FA running length densities for soft and stiff 1D and biaxial substrates (**p < 0.001). d Model of the cell mechanical response during sensing of uniaxial and biaxial cues. The uniaxial guidance cues result in highly anisotropic forces guided along adhesions and the actin fiber cytoskeleton (CSK) that are co-aligned with the uniaxial cues such that linear tension (λ) is distributed along the CSK structure. In contrast, biaxial cues provide opposing forces across a wide range of angles and adhesion sites resulting in robust mechanical feedback loops that promote traction stresses, FA maturation, and stress-fiber formation, inducing robust linear tension along arcs and formation of associated stress-fibers (bottom panels of a) that converge to generate higher stress magnitudes at FAs. Scale bars—15 µm. Corresponding n values are shown on the plot. Number of replicates (independent experiments) for all measurements N = 2. Data in c are mean ± s.d (boxes); ns indicates no significant difference between groups; *p < 0.05, **p < 0.001 (ANOVA)

