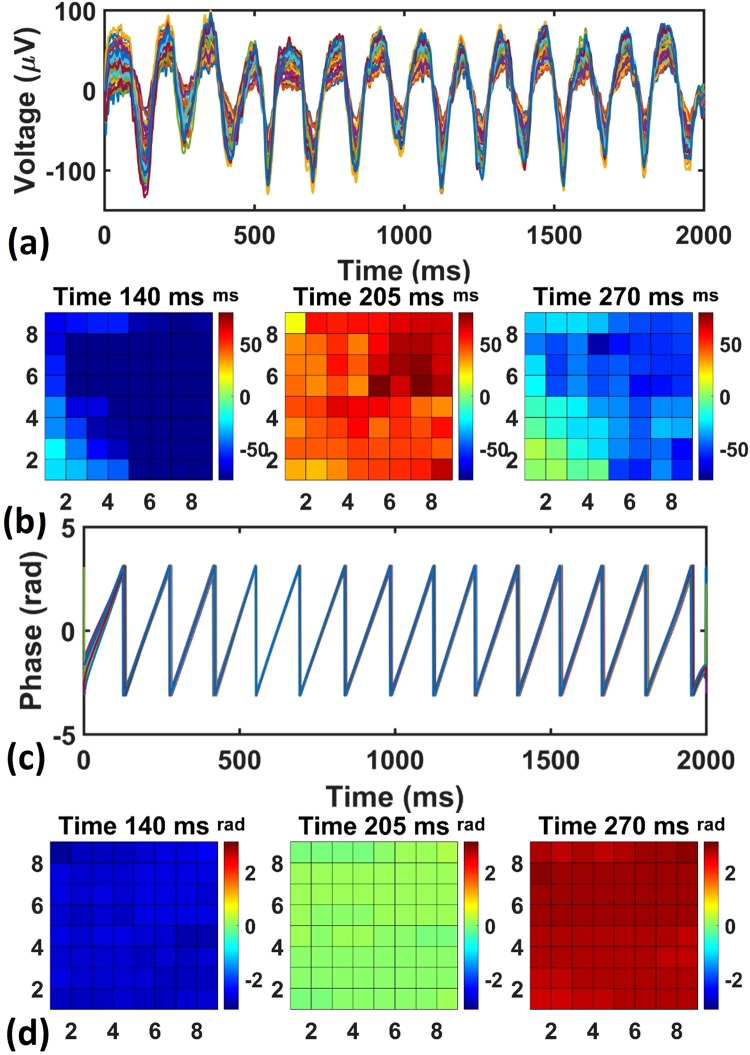
Figure 3.
Spatiotemporal analysis of theta oscillations. (a) Raw data recorded in all the channels, showing global 7 Hz low-amplitude theta oscillations under the anesthesia. (b) The amplitude maps for all the 64 channels at three different time points drawn from (a). (c) The phases of the electrical recordings that are filtered at theta band (5 Hz–9 Hz). The traces from all the 64 channels are plotted together to show synchrony among all the channels. (d) The phase maps at three different time points showing global stationary waves.

