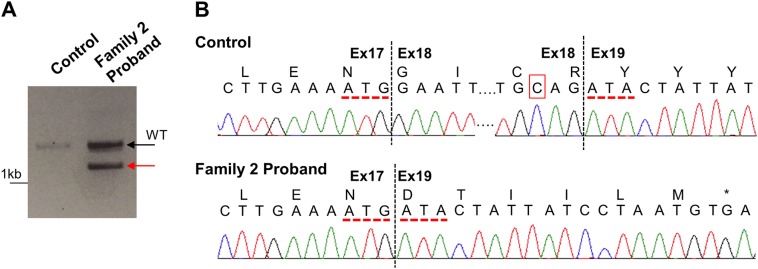
Fig. 3.
cDNA analysis of c.3342C>T in the proband in Family 2. a cDNA analysis was completed using RNA isolated from control and the proband (Family 2) kidney samples with primers spanning exons 16–20. While the control sample amplified a single WT band (black arrow), the proband (Family 2) had an alternative splice product (red arrow) in addition to the WT band. b Sanger sequencing analysis of the cDNA PCR products revealed that the WT band of the control and of the proband (Family 2) showed correct splicing across the intron/exon 19 junction resulting in a cDNA that included exons 17–19 (top). The alternative splice band of the proband (Family 2) showed skipping of exon 18 (r.3160_3344del), resulting in a frameshift and a premature stop codon six amino acids later (p.Gly1054Aspfs*7). Red dotted lines indicate exon 17/19 junctions; red box in control sample indicates the position of the c.3342C>T variant

