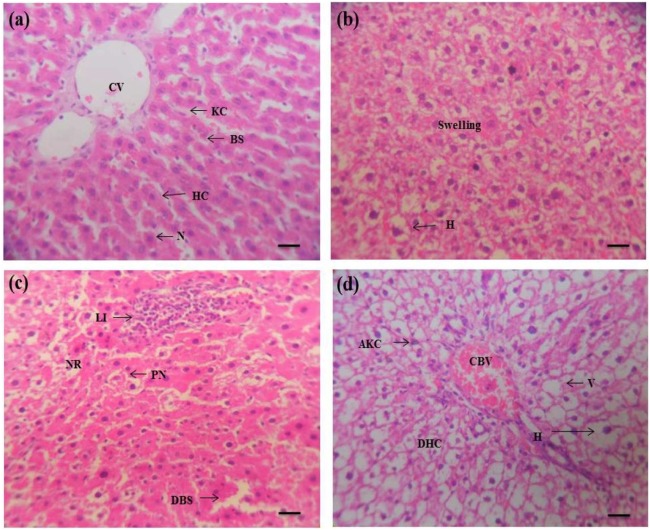
Figure 2.
Pendimethalin-induced histopathology in rat liver (×400). Panel a: liver of control rat showing normal histological appearance including Kupffer cell (KC), central vein (CV), hepatic cells (HC), blood sinusoids (BS) and centrally located nuclei (N). Panels b–d: liver sections of PND treated animals at lower, middle and high doses, exhibiting appearance of swelling, hyperplasia (H), pyknotic nuclei (PN), necrosis (NR), leukocyte infiltrations (LI), dilatation in blood sinusoids (DBS), activated Kupffer cells (AKC), large vacuolation (V), damage of hepatocytes (DHC), congested blood vessel (CBV) and hyperplasia (H). Each photomicrograph represents a section from an individual treated group of rat liver.

