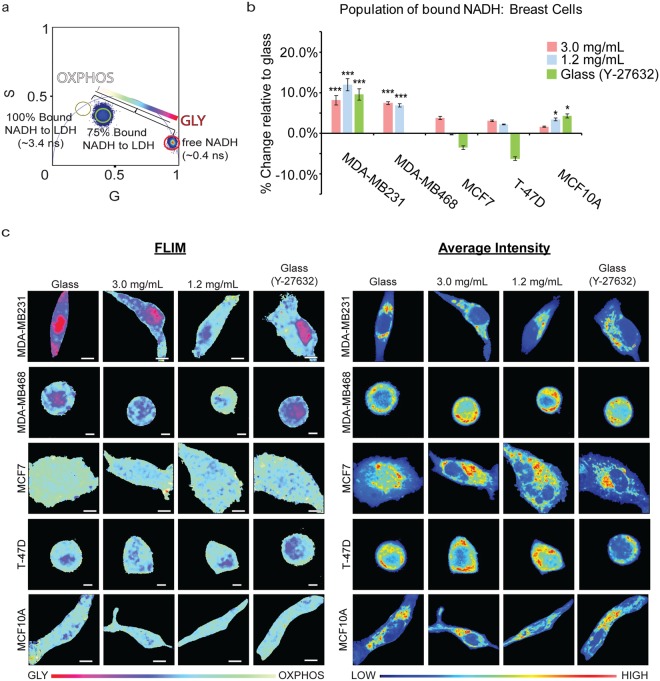
Figure 2.
Metabolic indexes of MDA-MB231 (3.0 mg/mL: n = 71; 1.2 mg/mL: n = 53; Glass: n = 77; Glass (Y-27632): n = 33), MDA-MB468 (3.0 mg/mL: n = 20; 1.2 mg/mL: n = 20; Glass: n = 5; Glass (Y-27632): n = 5), MCF7 (3.0 mg/mL: n = 20; 1.2 mg/mL: n = 21; Glass: n = 20; Glass (Y-27632): n = 21), T-47D (3.0 mg/mL: n = 5; 1.2 mg/mL: n = 5; Glass: n = 5; Glass (Y-27632): n = 5), and MCF10A (3.0 mg/mL: n = 64; 1.2 mg/mL: n = 59; Glass: n = 63; Glass (Y-27632): n = 26) cells on various collagen densities. (a) An increased population of bound NADH to LDH (long lifetime NADH, cyan) is indicative of a more OXPHOS signature while an increased population of free NADH (short lifetime NADH, red) would indicate GLY. These two extremes create a linear “M-trajectory” where a mixed population of bound and free NADH, for example 75%, will lie between these two points. (b) Percent increase of bound NADH in MDA-MB231, MDA-MB468, MCF7, T-47D, and MCF10A cells relative to glass. (c) Colored images of FLIM of NADH and the average intensity of NADH within MDA-MB231, MDA-MB468, MCF7, T-47D, and MCF10A cells. n = total number of cells measured. *p < 0.05, **p < 0.01, and ***p < 0.001 by Student’s t-test. Scale bar: 5 µm. Error bars are based on standard deviation.

