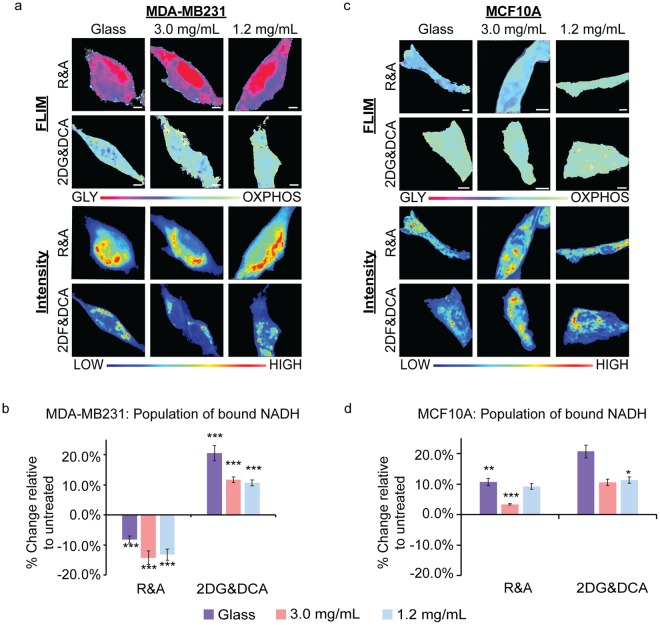
Figure 4.
MDA-MB231 and MCF10A metabolic indexes when treated with metabolic inhibitors. (a) MDA-MB231 and (b) MCF10A cells treated with rotenone and antimycin A (R&A) or 2-deoxyglucose and dichloroacetate (2DG&DCA) for OXPHOS or GLY inhibition, respectively. FLIM images show the shifts in metabolic indexes with respective intensity images below. (c) Quantification of the change of bound NADH in MDA-MB231 with R&A (Glass: n = 29; 3.0 mg/mL: n = 29; 1.2 mg/mL: n = 29) or 2DG&DCA (Glass: n = 29; 3.0 mg/mL: n = 19; 1.2 mg/mL: n = 21) relative to untreated cells. (d) Quantification of the change of bound NADH in MCF10A with R&A (Glass: n = 25; 3.0 mg/mL: n = 20; 1.2 mg/mL: n = 15) or 2DG&DCA (Glass: n = 21; 3.0 mg/mL: n = 24; 1.2 mg/mL: n = 22) relative to untreated cells. n = total number of cells measured.*p < 0.05, **p < 0.01, and ***p < 0.001 or less by Student’s t-test. Scale bar: 5 µm. Error bars are based on standard deviation.

