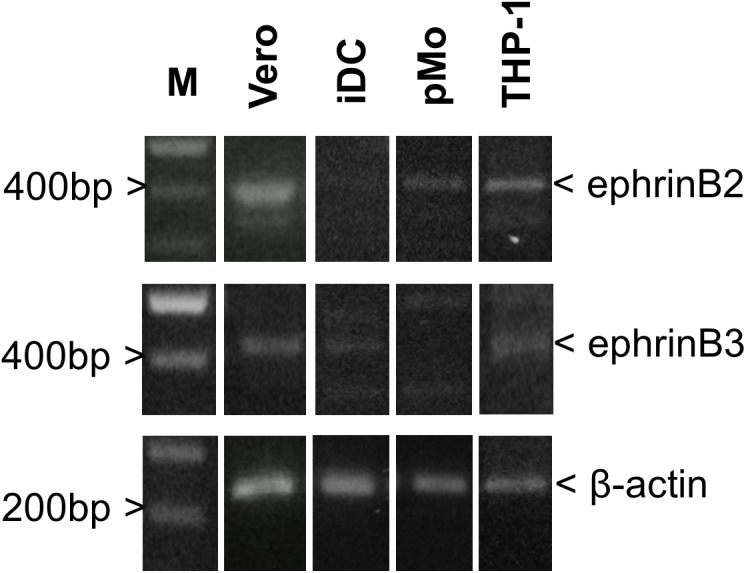
FIGURE 2.

PCR amplification for detection of endogenous mRNA levels of ephrinB2, ephrinB3 and β-actin in iDC, pMO, THP-1, and Vero cells. Amplified products were visualized on a 1.8% (w/v) agarose gel. Lane M – GeneRuler 100 bp DNA Ladder Plus (Promega, United States). Figure shows the representative results from two independently performed amplifications.
