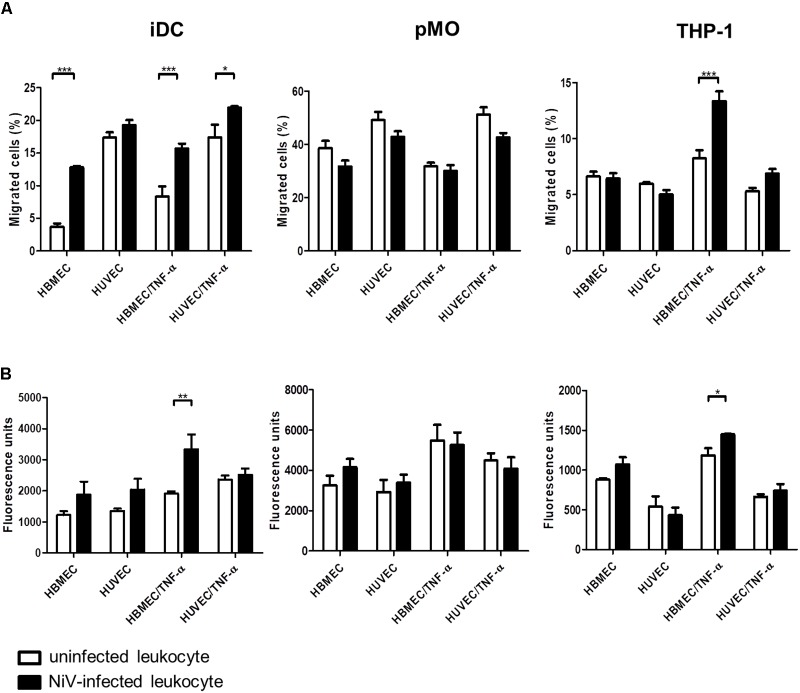
FIGURE 4.
Transendothelial migration of iDC, pMO, and THP-1, either mock-infected or infected with NiV, across untreated and TNF-α-treated HBMEC and HUVEC: (A) migration was presented as the percentage of migrated cells [represented on the y-axis as migrated cells (%)], and (B) permeability of endothelial monolayers after transendothelial migration as measured by the flux of 70 kDa fluorescein-dextran (represented on the y-axis as fluorescence units). Values are the average of three biological replicates and error bars indicate standard deviation (∗p < 0.05, ∗∗p < 0.01, ∗∗∗p < 0.001). Data is representative of two independent biological replicates.

