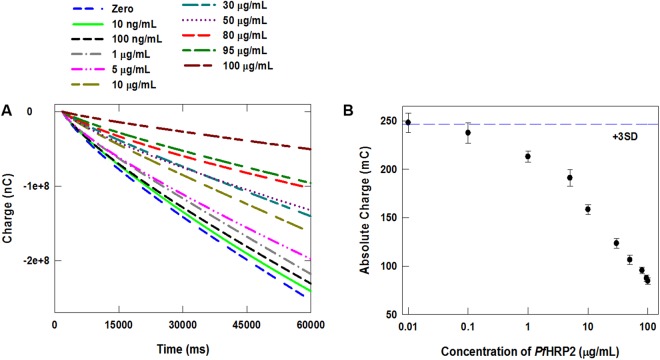
Figure 5.
(A) Chronocoulograms of whole blood containing various concentrations of PfHRP2 recorded at −0.35 V using the immunosensor. (B) Calibration plot based on chronocoulometric charges at 60 sec obtained from the response profile in panel A. Each data point represents the mean ± SD of three separate measurements using new sensors. The dashed line corresponds to 3× the charge SD at zero concentration determined by seven measurements.

