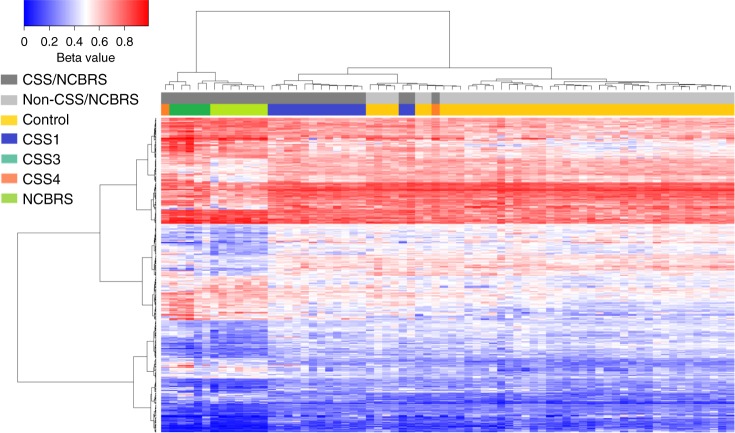
Fig. 2.
Clustering analysis using the probes identified for NCBRS. Clustering analysis was performed using Ward’s method on Euclidian distance. Rows represent the CpG probes, and columns represent the subjects. The color scale from dark blue to dark red represents the range of the methylation levels (beta values) between 0 and 1. The top pane represents the overall status of the condition, i.e., CSS/NCBRS vs. non-CSS/NCBRS. The lower pane indicates the subtype for every sample including CSS1 (dark blue), CSS3 (dark green), CSS4 (orange), NCBRS (light green), and controls (yellow). Hierarchical clustering of 365 probes differentially methylated between patients with NCBRS selectively groups CSS3 and NCBRS samples into one cluster, but CSS1 and controls into the other. The two CSS4 subjects are split between the two clusters

