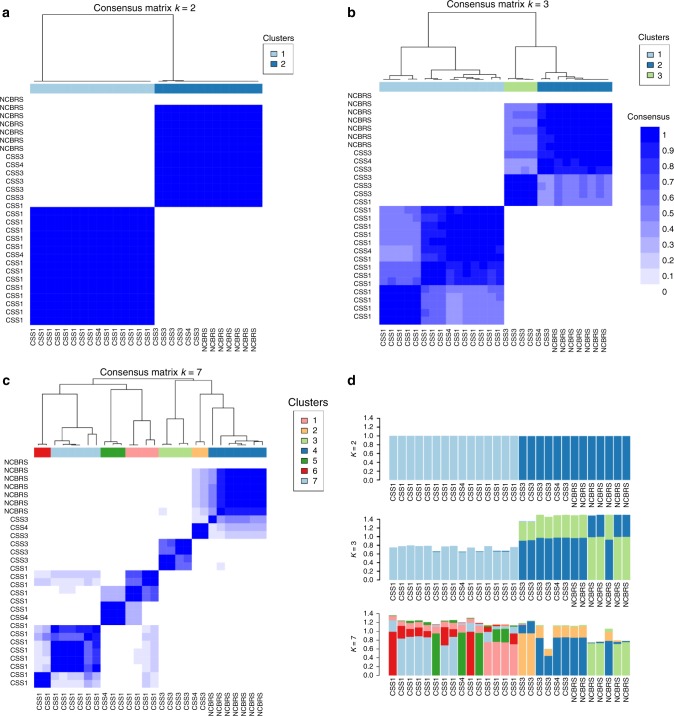
Fig. 3.
Consensus clustering analysis of CSS/NCBRS patients. A 1000 repeat iterations of K-means clustering on Spearman’s distance was performed, each for a random 80% subsampling of all significant probes and patients, for clustering counts (k) 2–10. The most stable cluster (optimal k) was determined using the PAC measure as two (Supplementary Figure 12). a, b, c Consensus cluster heatmaps at k = 2, 3, and 7. Both rows and columns are samples. The intensity of blue represents how often every two samples from the rows and columns cluster together in the 1000 repeat iterations. The pane on top demonstrates the consensus cluster for each sample. At k = 2, CSS3 and NCBRS samples always cluster together while they never group with CSS1 samples. As the k increases, more clusters are identified within the initial two groups. At k = 7 (c), CSS3 subjects for the first time belong to clusters with no NCBRS membership, while at the same time a larger number of clusters are formed within the initial CCS1 class. d Item-consensus plots for heatmaps in a–c. Every subject has an item-consensus value for each of the identified clusters at different ks, as indicated by the segmental lengths of the bars, representing the level of consensus of that sample with the members of other clusters (indicated by cluster label colors). The plot at k = 2 shows that none of the two clusters contain any consensus with members of the other, being very pure members of their own clusters. As the k increases, the purity is reduced. At k = 7, all of the samples in NCBRS cluster (dark blue) harbor >20% consensus with the two samples in the yellow cluster (composed of CSS3 and CSS4). These two samples also show the same amount of consensus with NCBRS members, but they have very little consensus with the light green cluster, composed of other CSS3 samples, suggesting that these clusters do not represent differences between CSS3 and NCBRS. None of these patterns are related to batch effect. The three ks represented here were chosen as they harbor subdivisions within the CSS-NCBRS cluster. For complete data see Supplementary Figures 2–18

