. 2018 Nov 5;10(44):5273–5281. doi: 10.1039/c8ay01807c

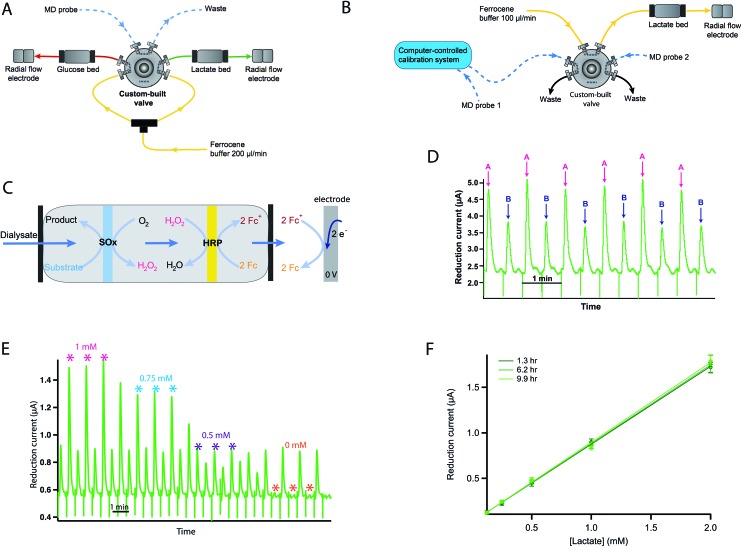
Fig. 2. (A) rsMD setup for measurement of glucose and lactate in one sample stream. The microdialysis (MD) probe outlet is connected to the sample loop of the flow injection valve. Every 30 s a dialysate sample is injected alternately into the analysis flow stream for either glucose or lactate. (B) rsMD setup for measurement of lactate in two samples streams with autocalibration. The outlet of MD probe 1 is connected directly to the autocalibration board, which is connected to a loop of the flow injection valve, the outlet of MD probe 2 is connected to the opposite side of the analysis loop. Every 30 s a dialysate sample is injected into the analysis flow stream, alternating between each sample stream. (C) Reaction sequence occurring within the immoblised enzyme bed. The dialysate sample is mixed with the Fc mediator solution and is pumped through two membranes loaded with enzyme, the first with the SOx and the second with HRP. The enzymatic reactions result in the production of 2 ferrocenium ions (Fc+), which are detected at the glassy carbon electrode by reduction at 0 V. (D) Example of raw data peaks alternating between measurements from two different ex vivo organs, A and B. (E) Example of raw data for a 4-point lactate autocalibration, peaks alternating between the calibration stream (marked with an asterisk) and the second dialysate stream. (F) Example of repeated lactate calibration curves over a 10 hour monitoring period (at 1.3 h, 6.2 h and 9.9 h after monitoring began) showing long-term stability of the analysis method. Points are fitted with a straight line. Markers indicate the mean ± standard deviation for each measurement (n = 3).

Fig. 2