. 2018 Nov 5;10(44):5273–5281. doi: 10.1039/c8ay01807c

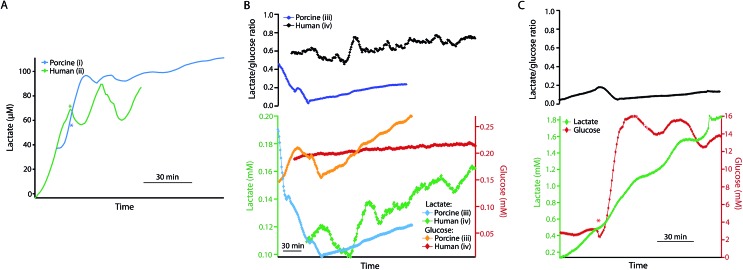
Fig. 5. (A) Dialysate lactate levels in a porcine (i) and a human (ii) pancreas during haemoperfusion and reperfusion, respectively, following 24 or 25 h SCS and 5 h HMP. The porcine pancreas was perfused with blood and the human pancreas with oxygenated Krebs–Henseleit buffer at body temperature. The asterisk indicates the point at which additional glucose was added into the reperfusion solution, making the final concentration 22 mM. (B) Dialysate measurements for a porcine (iii) and a human (iv) pancreas during HMP following a long CIT (48 h and 57 h SCS). Dialysate glucose measurements are shown in yellow and red for the porcine and human pancreases, respectively, and dialysate lactate is shown in blue and green. The top trace shows the corresponding lactate/glucose ratio in for the porcine pancreas (iii) in blue and the human pancreas (iv) in black. (C) Dialysate glucose (red) and lactate (green) levels in human pancreas (iv) during reperfusion with warm oxygenated Krebs–Henseleit buffer following HMP. The red asterisk indicates the point at which additional glucose was added to the reperfusion solution, making the final concentration 22 mM. The top trace shows the corresponding lactate/glucose ratio. Data were obtained in real time using rsMD, with a point every minute.

Fig. 5