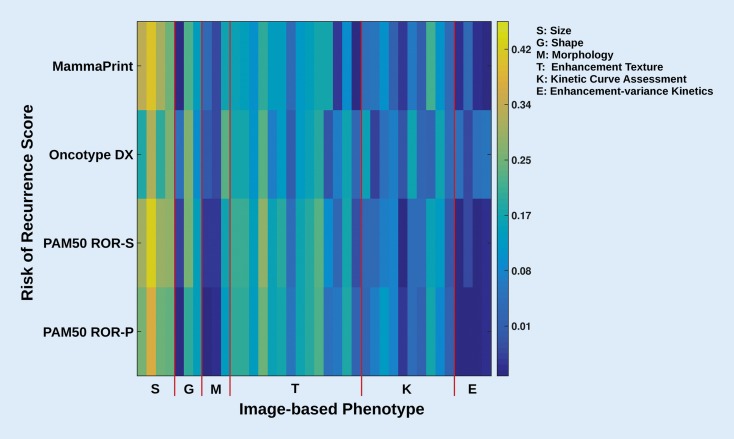
Fig. 3.
Color map showing the correlation of MRI-based phenotypes with the recurrence predictor models of MammaPrint, OncotypeDX, PAM50 ROR-S, and PAM50 ROR-P. Here, yellow indicates higher correlation than blue. The different gene assays (recurrence predictor models) serve as “reference standard” in this study. ROR-P risk of relapse based on proliferation, ROR-S risk of relapse based on subtype. (Reprinted with permission from [28], this content is not part of the Open Access licence)

