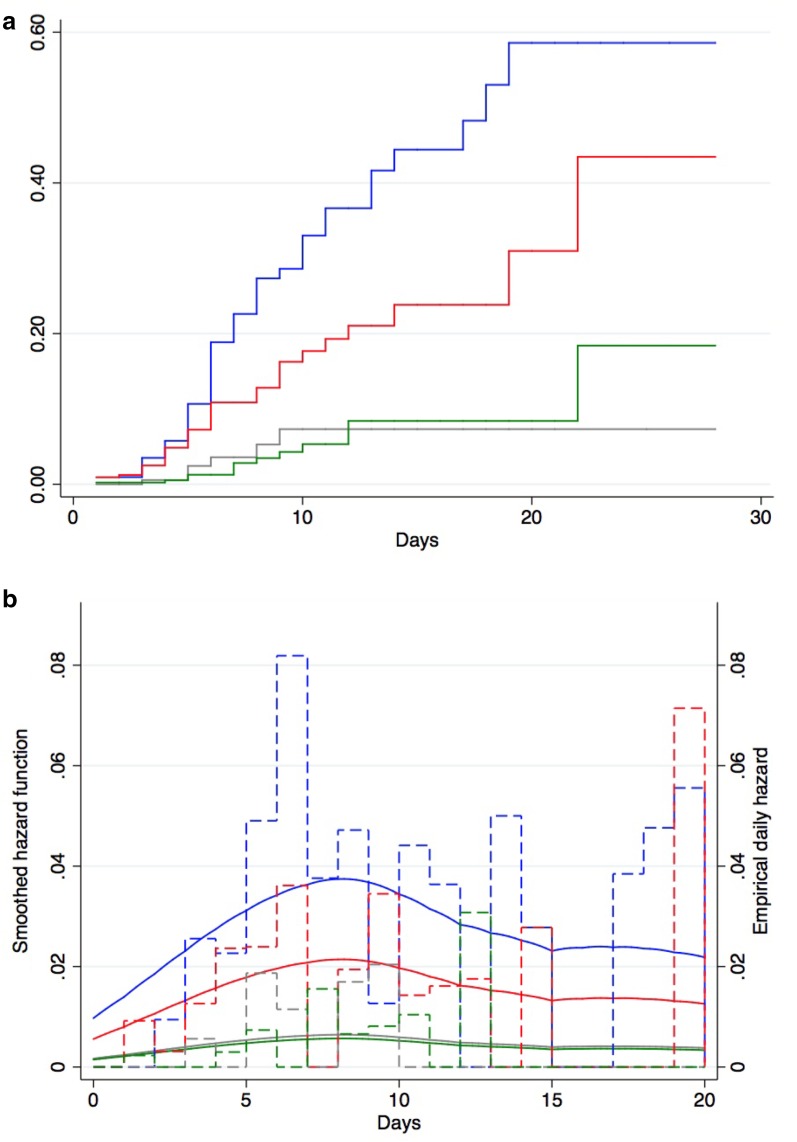
Fig. 3.
Cumulative cause-specific hazard (a) and daily hazard rates (b) of ventilator-associated pneumonia in the pre-intervention period, the intervention period without SOD, implementation of SOD and the post-intervention period using Cox proportional cause-specific hazard regression. a, b Blue lines represent the pre-intervention period, red lines the intervention period without SOD, gray lines the period after implementation of SOD, green lines the post-intervention period. b Dashed lines empirical daily hazard of VAP, solid lines smoothed hazard function

