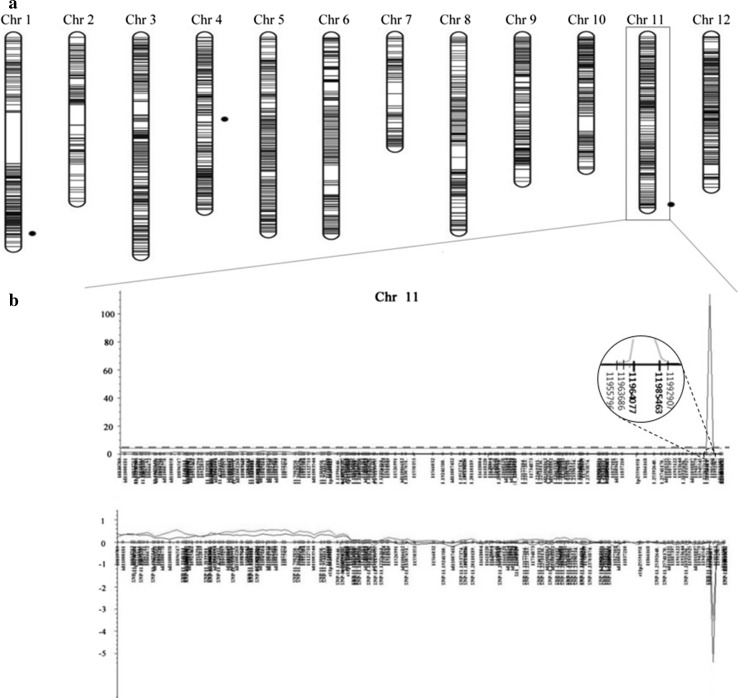
Fig. 2.
Linkage map and QTL analysis using F2 mapping population. a Genetic linkage map of the 12 chromosomes based on 1954 SNP markers segregating in the P6/Ilpum 493 F2 plants. Black dots beside chromosomes 1, 4, and 11 represent the positions of detected QTLs. b The LOD profile and additive effect of major QTL analyzed by inclusive composite interval mapping on chromosome 11. The SNP location was positioned in the whole genome. The positive additive effect was derived from the susceptible parent Ilpum, whereas the negative value was related to the resistant parent. The dotted line is LOD threshold calculated by 1000 permutations

