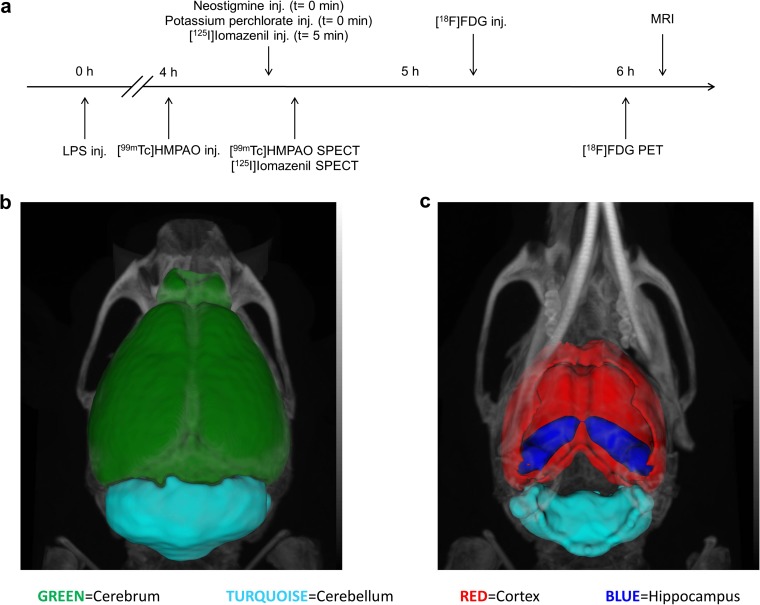
Fig. 1.
Illustration of the methods. a Experimental protocol for in vivo measurements. b Dorsal view of MRI coregistration with CT showing the segmented 3D brain regions. c Ventral view of the same VOIs (volumes of interest). Representing the cerebrum (green: this entity includes the whole brain without cerebellum), cerebellum (turquoise), cortex (red), and hippocampus (blue).

