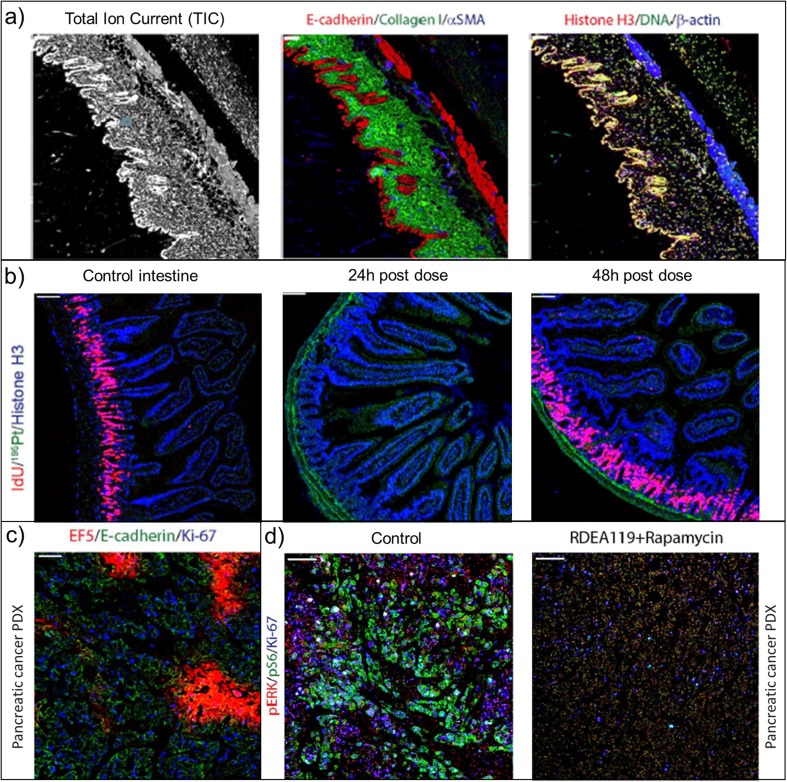
Fig. 6.
Selection of IMC images from various applications adapted from [53, 54]. (a) Tissue architecture: representative total ion current image (left) of mouse abdominal wall, overlay of three tissue type markers (middle) β-actin, histone H3 and iridium DNA intercalator, (right) E-cadherin, collagen and αSMA. (b) Functional markers: representative IdU, 195Pt and histone H3 images of control and cisplatin-dosed (4 mg/kg for 24 and 48 h) small mouse intestine. (c) Tumour microenvironment (TME): pancreatic cancer patient–derived xenograft (PDX) assessment using EF5 tracer, E-cadherin and Ki-67. (d) Target engagement: control and dosed pancreatic cancer PDX tissue evaluation.

