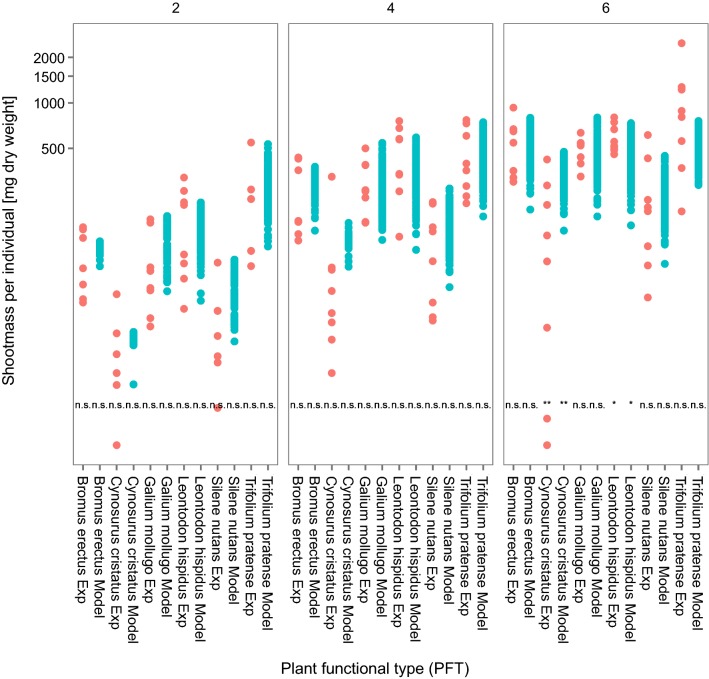
Fig. 2.
Model calibration to empirical monocultures: Comparing the shoot weight of experimentally measured (red points, N = 8) and modeled (blue points, N = 900 covering potential variability in resource levels) data for each assessment date in control monocultures. Experimental values measured in fresh weight were converted to dry weight using a conversion factor based on a repeated monoculture control experiment, in which we measured the fresh to dry weight ratio of each species (see Additional file 1: Appendix B for further details). Both broad spectrum herbicide and selective herbicide control values are included in the experimental data. Each experiment model pair was tested for significance using a t test; not significant results indicate that there are no differences between experimental and model data. Please note the logarithmic scale of the y-axis

