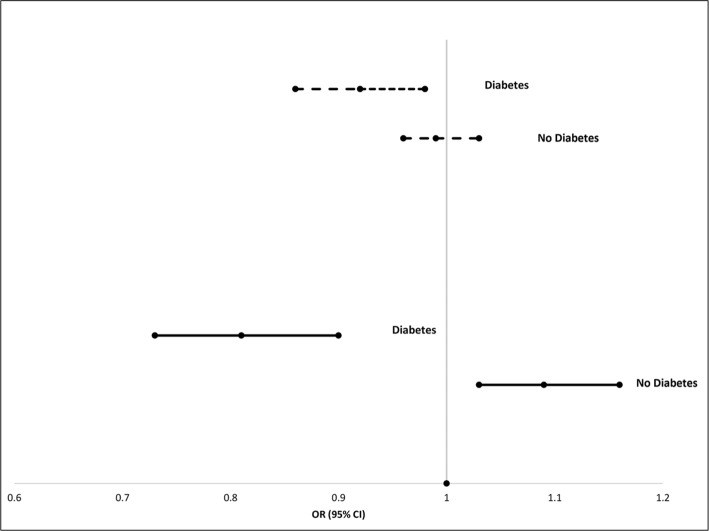
Figure 1.
Relationship of PFOA and PFOS with CKD, stratified by diabetes status. Gray lines = PFOA. Black lines = PFOS. Analyses adjusted for age, sex, BMI, HDLc, LDLc, white blood cell count, CRP, hemoglobin, and iron.
Abbreviations: BMI, body mass index; CKD, chronic kidney disease; CRP, C-reactive protein; HDLc, high-density lipoprotein cholesterol; LDLc, low-density lipoprotein cholesterol; PFOA, perfluorooctanoic acid; PFOS, perfluorooctane sulfonate.

