Figure 1.
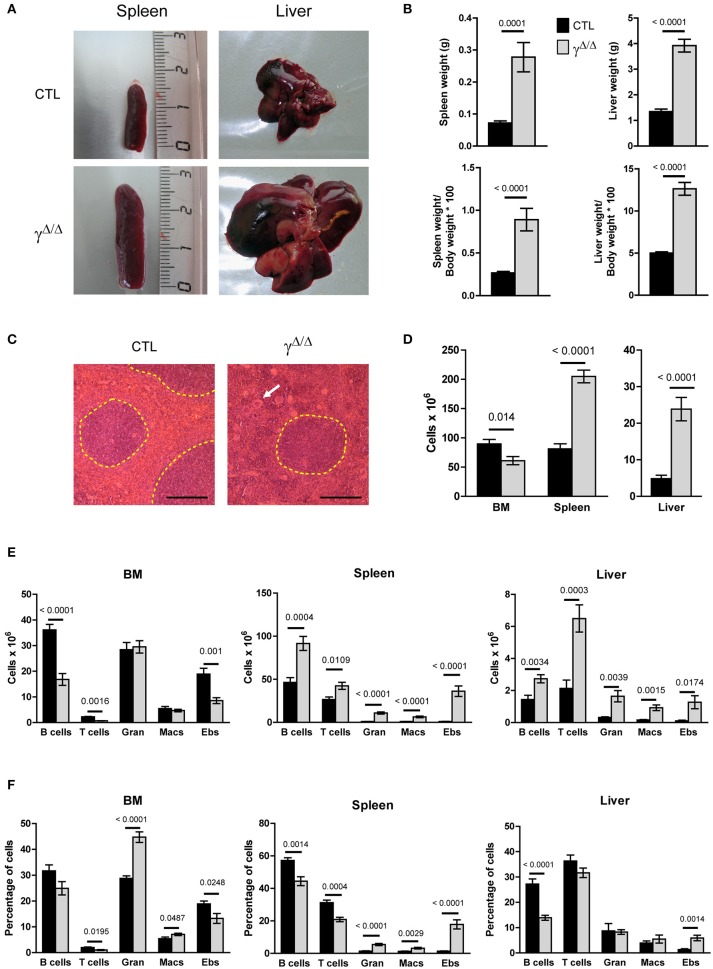
Evaluation of hematopoiesis-derived cell populations in the bone marrow (BM) and peripheral organs of PpargΔ/Δ mice. (A) Representative photographs of the spleens and livers of PpargΔ/Δ (γΔ/Δ) mice (lower panels) and littermate control (CTL) mice (upper panels). (B) Spleen and liver weight in grams (top panels) and expressed as % of the body weight (bottom panels). (C) Hematoxylin & eosin staining of spleen sections; White pulp areas are circled by a dotted line. The white arrow indicates one of the numerous megakaryocytes present in the red pulp in PpargΔ/Δ mice. The black bar indicates 200 micrometers. (D) Total hematopoietic cell numbers in the BM (2 tibias and 2 femurs from each mouse), spleen, and liver of control and PpargΔ/Δ mice. Mean ± SEM, n = 7–8 mice per genotype. (E) Total numbers of mature hematopoietic cell subsets in the BM (left panel), spleen (middle panel) and liver (right panel) of control (dark bars) and PpargΔ/Δ (light bars) mice. (F) Same as in (E), with cell numbers expressed as a % of the total cell number in the corresponding organ. T cells (CD3+); B cells (B220+); Gran: granulocytes (Gr1+CD11b+), Macs: macrophages (Gr1−CD11b+), Ebs: erythroblasts (Ter119+CD71+); Mean ± SEM n = 7–8 mice per genotype. All significant p-values are indicated above the corresponding bars.

