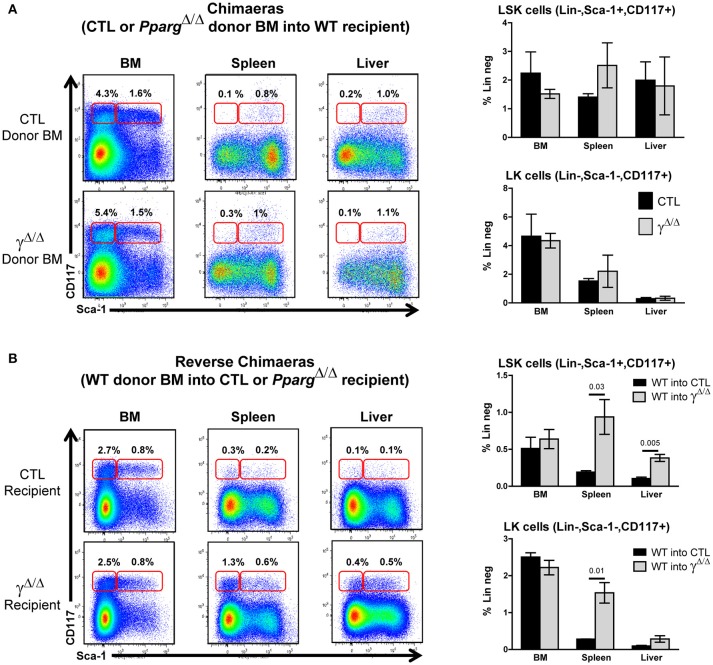
Figure 3.
Extramedullary hematopoiesis is non-cell autonomous. (A) Chimeras using wild-type recipient: Control or PpargΔ/Δ donor BM (both CD45.2+) was transferred into wild-type (WT) recipient CD45.1+ mice. Hematopoietic reconstitution was evaluated by FACS analysis 3 months after lethal γ-radiation and i.v. transfer of T-depleted BM. Left panels: representative FACS plots of Sca-1 vs. CD117 (cKit-r) on lineage-negative donor (CD45.2+) BM (left), spleen (middle) or liver (right) cells from mice reconstituted with control BM (top row) or PpargΔ/Δ BM (lower row). The red frames on the left and right of each plot indicate the gating and percentage of LK (Lineage-negative, Sca-1−CD117+) and LSK (Lineage-negative, Sca-1+CD117+) cells, respectively. Right panels: Relative proportions (in %) of LSK cells (top panel) and LK cells (bottom panel) over the total cell population of the BM, spleen, and liver. Dark bars represent donor control BM, and light bars represent donor PpargΔ/Δ BM, both transplanted into WT host mice. Mean ± SEM, n = 3 mice per genotype. There are no significant p-values. (B) Reverse chimeras: Wild-type (WT) control donor BM (CD45.1+) was transferred into CTL or PpargΔ/Δ recipient CD45.2+ mice. Left panels: representative FACS plots of Sca-1 vs. CD117 (cKit-r) on lineage-negative donor (CD45.1+) BM (left), spleen (middle), or liver (right) cells transferred into either CTL (upper row) or PpargΔ/Δ (lower row) recipient mice. The red frames on the left and right of each plot indicate the gating and percentage of LK (Lineage-negative, Sca-1−CD117+) and LSK (Lineage-negative, Sca-1+CD117+) cells, respectively. Right panels: Relative proportions (in %) of LSK cells (top panel) and LK cells (bottom panel) over the total cell population of the BM, spleen, and liver. Dark bars represent donor control BM into CTL mice, and light bars represent donor control BM into PpargΔ/Δ mice. Mean ± SEM, n = 3 mice per genotype. All significant p-values are indicated above the corresponding bars.

