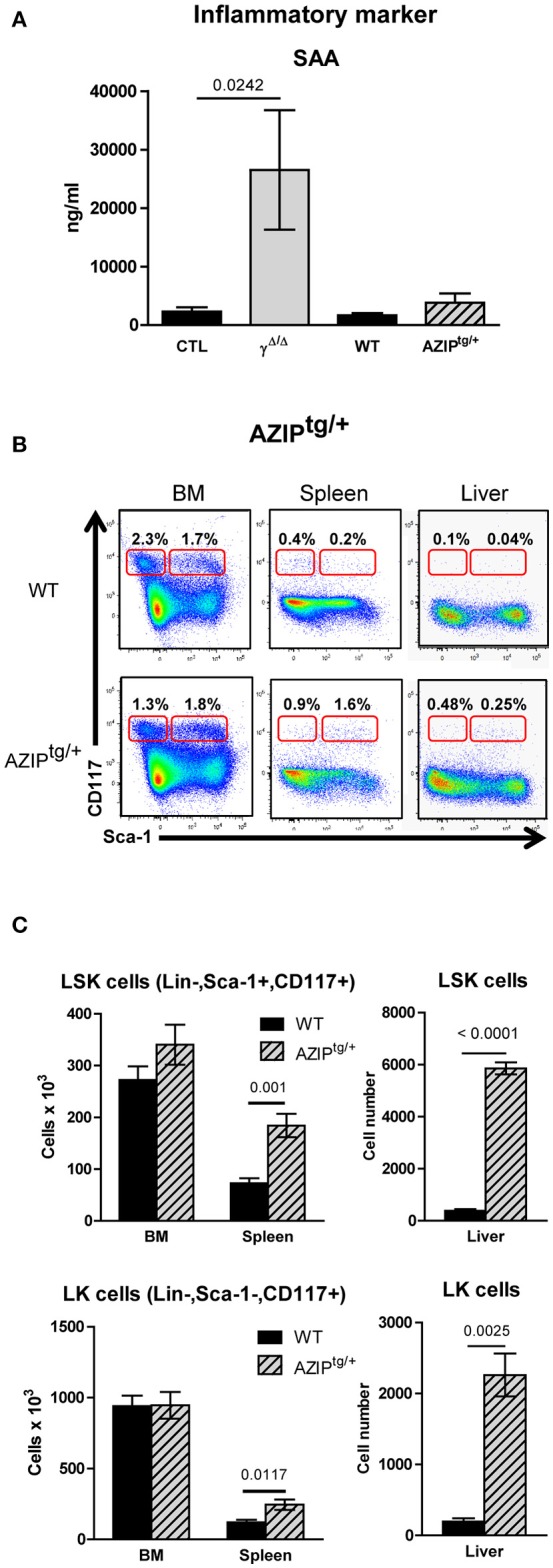
Figure 4.

Investigation of extramedullary hematopoiesis in AZIPtg/+ mice. (A) Serum levels of the inflammatory marker Serum Amyloid A in PpargΔ/Δ and in AZIPtg/+, evaluated by ELISA. Mean ± SEM for 3 to 8 mice per genotype. (B) Representative FACS plots showing Sca-1 vs. CD117 staining on lineage-negative bone marrow (BM; left panels) and spleen (middle panels) and liver (right panels) cells from AZIPtg/+ (lower row) mice and their wild-type (WT) littermates (upper row). The red frames on the left and right of each plot indicate the gating and percentage of LK (Lineage-negative, Sca-1−CD117+) and LSK (Lineage-negative, Sca-1+CD117+) cells, respectively, expressed as a percentage of lineage-negative cells from each organ. (C) Histograms showing total numbers of LSK (left panel) and LK (right panel) cells in the BM, spleen and liver of WT control (dark bars) and AZIPtg/+ (light hatched bars) mice. Mean ± SEM, n = 3–6 mice per genotype. All significant p-values are indicated above the corresponding bars.
