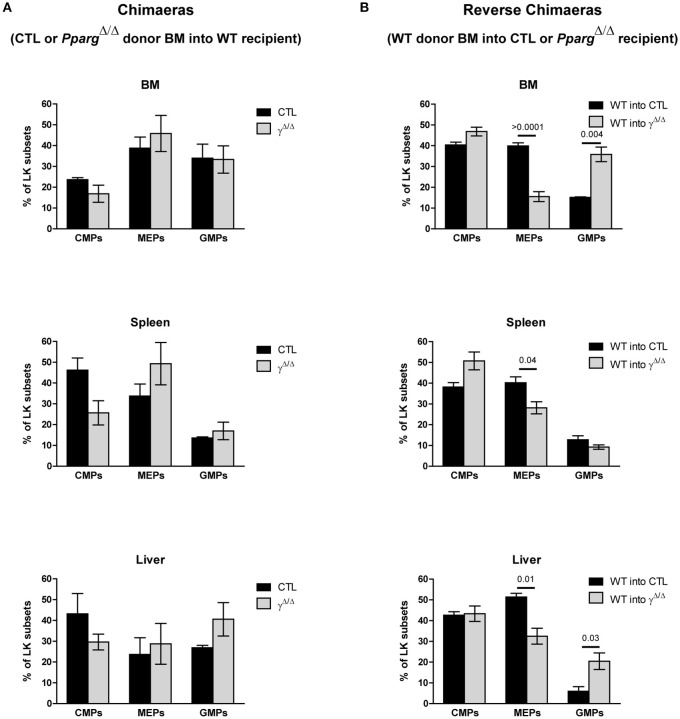
Figure 6.
FACS analyses of progenitor cell subsets in the LK population in chimeras and AZIPtg/+ mice. (A) Chimeras using wild-type recipients and control or PpargΔ/Δ donor BM. Hematopoietic reconstitution was evaluated by FACS analysis 3 months after the transfer (see also Figure 3A). The histograms show the proportion (%) of CMPs (CD34lowCD16/32−), MEPs (CD34−CD16/32−), and GMPs (CD34+CD16/32+) in the LK cell subset, in the BM, the spleen and the liver of WT mice reconstituted with control (dark bars) or PpargΔ/Δ (light bars) BM. Mean ± SEM, n = 3 mice per genotype. No significant p-value. (B) Reverse chimeras using wild-type (WT) control donor BM transferred into PpargΔ/Δ or their littermate control (CTL) recipient. The histograms show the proportion (%) of CMPs, MEPs and GMPs in the LK cell subset in the BM, the spleen and the liver of control (dark bars) or PpargΔ/Δ (light bars) mice reconstituted with wild-type donor BM. Mean ± SEM, n = 3 mice per genotype. All significant p-values are indicated above the corresponding bars.

