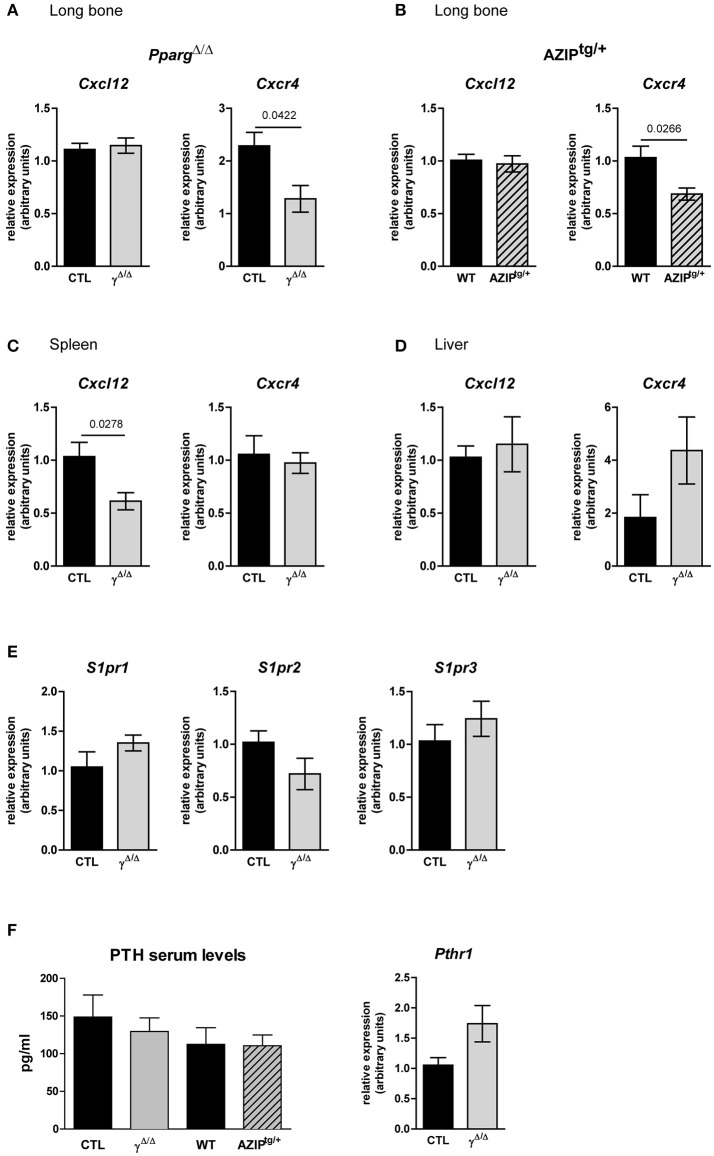
Figure 7.
Gene expression of key factors of cell egress from the BM in PpargΔ/Δ and AZIPtg/+ mice. (A,B) Cxcl12 and Cxcr4 mRNA expression in the long bones of PpargΔ/Δ (A) and AZIPtg/+ (B) mice and their controls, CTL and WT, respectively, as indicated. Mean ± SEM for 3 to 6 mice per genotype. (C,D) Cxcl12 and Cxcr4 mRNA expression in the spleen (C; Mean ± SEM for 5 mice per genotype) and the liver (D; Mean ± SEM for 6 to 7 mice per genotype) of PpargΔ/Δ mice and their control. (E) Expression levels of Sphingosine Sphingosine kinase/sphingosine 1-phosphate receptors genes, S1pr1, S1pr2, S1pr3, in the long bone of PpargΔ/Δ mice and their control. (F) Parathyroid hormone (PTH) serum levels and gene expression of its receptor PTHR1 in long bones of PpargΔ/Δ mice and their control Mean ± SEM for 3 to 4 mice per genotype. All significant p-values are indicated above the corresponding bars.

