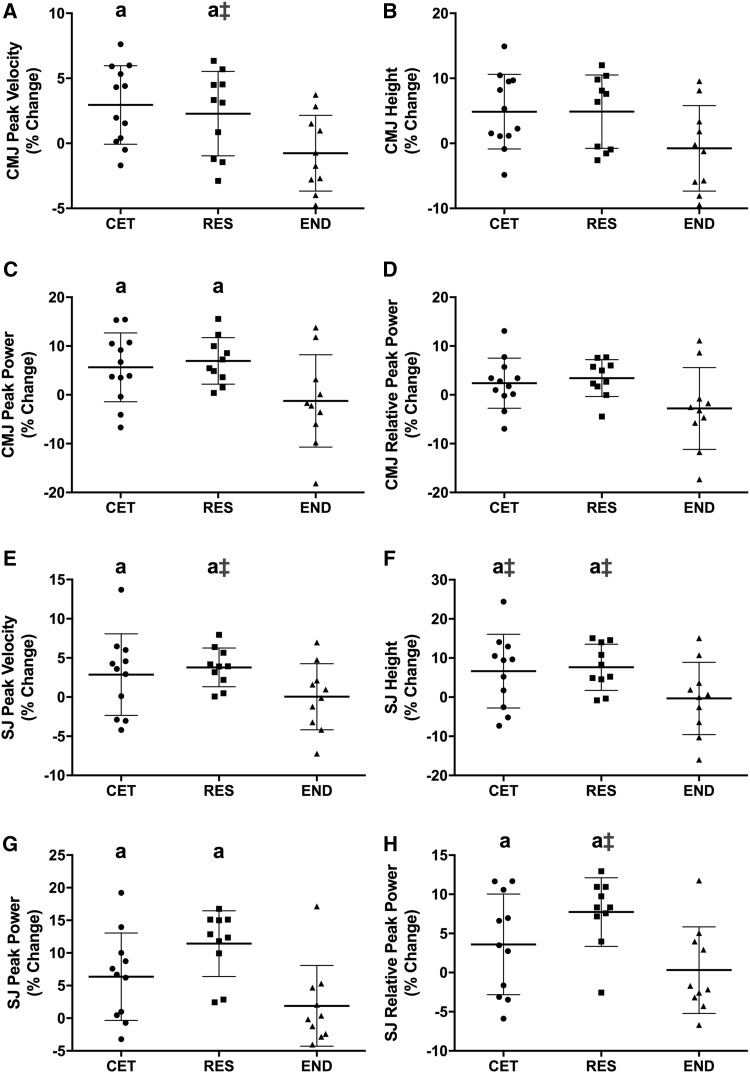
Fig. 3.
Change to countermovement jump (CMJ) and squat jump (SJ). Percent changes from PRE to POST for CMJ are presented for (a) peak velocity, (b) height, (c) peak power, and (d) relative peak power. Percent changes from PRE to POST for SJ are presented for (e) peak velocity, (f) height, (g) peak power, and (h) relative peak power. Values are presented as individual data with group mean ± SD. a = P < 0.05 from PRE. ǂ = P < 0.05 from END at POST. CET concurrent exercise training, RES resistance training, END endurance training

