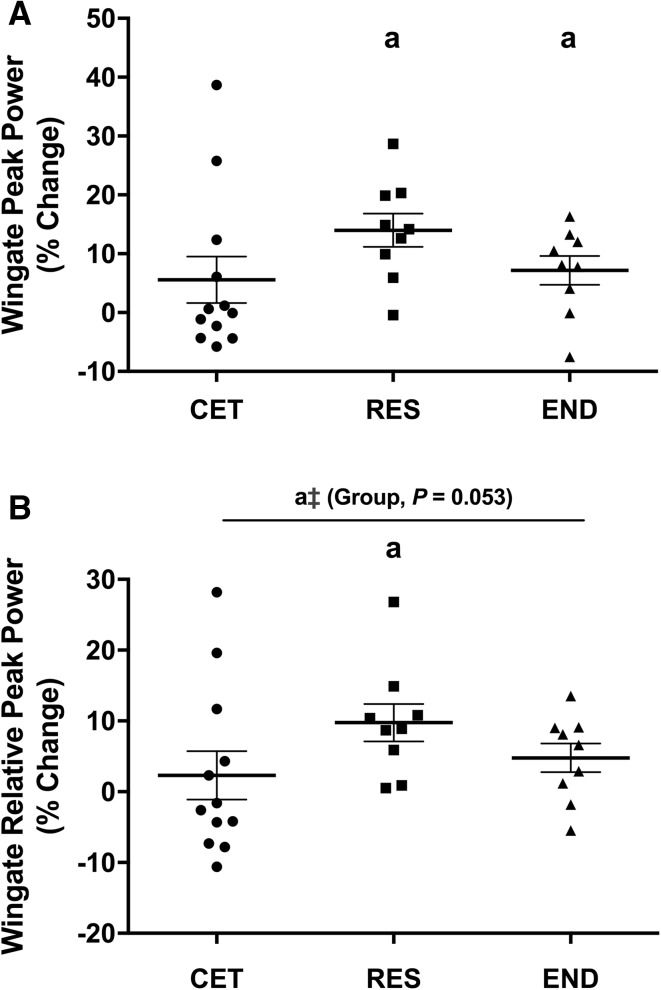
Fig. 5.
Change to (a) absolute and (b) relative Wingate peak power. Values are presented as percent change from PRE to POST and presented as individual data with group mean ± SD (RES, n = 9; END, n = 9). a = P < 0.05 from PRE. ǂ = P < 0.05 from END at POST. * = P < 0.05 from CET at POST. CET concurrent exercise training, RES resistance training, END endurance training

