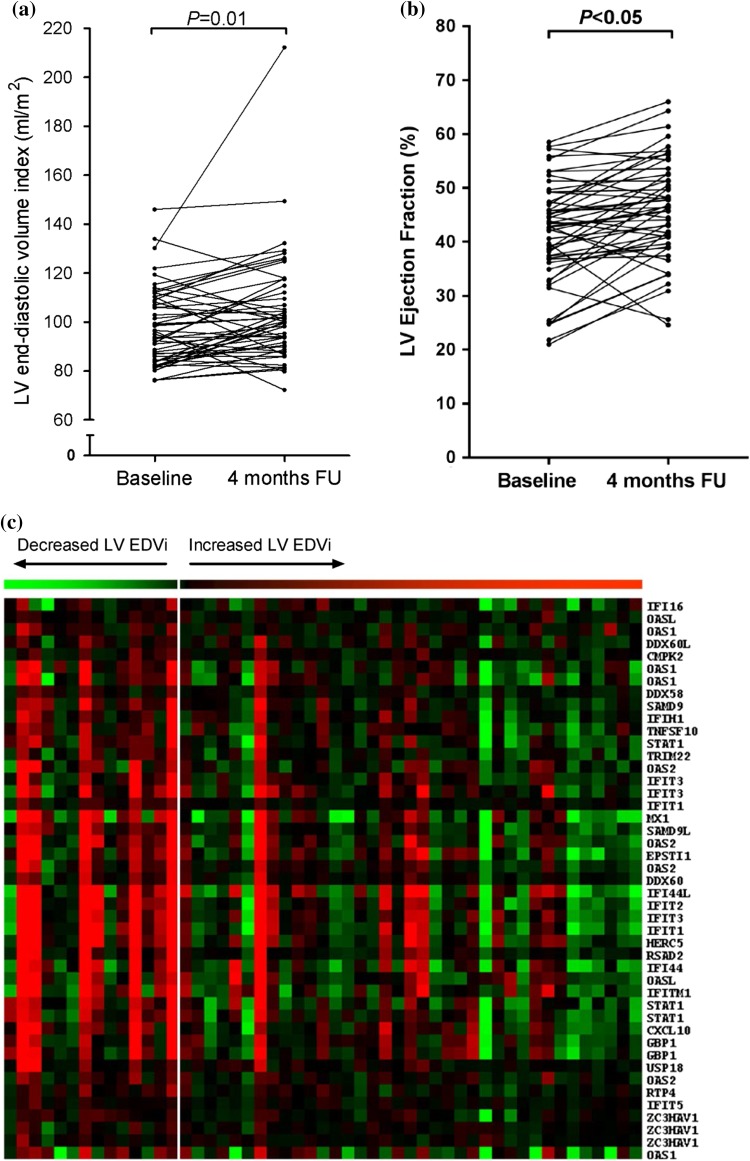
Fig. 1.
Increased IFN type I expression in monocytes of MI patients with a decreased EDVi baseline–4-month FU. a The change in LV EDVi from baseline to 4-month follow-up. b The change in LV EF from baseline to 4-month follow-up. c Heat map showing the expression of genes of the MOSERLE_IFNA_RESPONSE pathway supervised by the change in LV EDVi from baseline to 4-month follow-up. Each column represents one patient. Patients with a decreased LV EDVi at 4-month follow-up are placed on the left side (n = 14) and patients with an increased LV EDVi on the right side (n = 37). Red denotes relatively high gene expression, green represents relatively low-expressed genes. Note the relative high expression of genes of the MOSERLE_IFNA_RESPONSE pathway in patients with a decreased LV EDVi at 4-month post-MI (right side). Statistical analyses are performed using the Student’s t test. EDVi end-diastolic volume index, EF ejection fraction, FU follow-up, LV left ventricular

