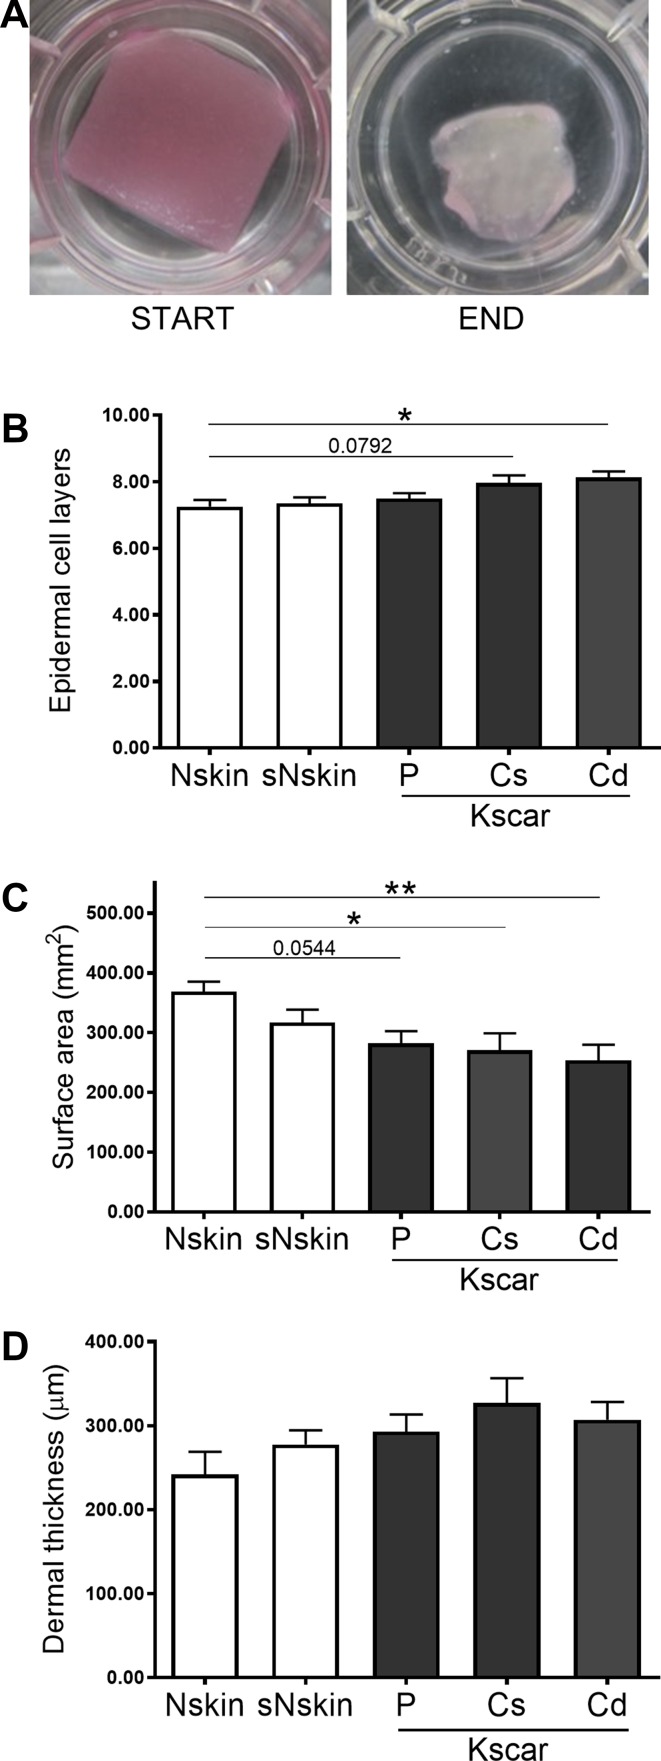
Fig. 2.
Increased contraction, epidermal and dermal thickness in central keloid regions. Absolute surface area of the skin models was measured in duplicate in n = 8 normal skin (Nskin), n = 8 peripheral keloid (P-Kscar), n = 7 central superficial keloid (Cs-Kscar), n = 7 central deep keloid (Cd-Kscar), n = 5 surrounding normal skin (sNskin). a shows macroscopic views of SE at the start and end of culturing; b shows the number of viable epidermal cell layers in the SE; c shows the dermal thickness measured in µm; d shows contraction measured as a reduction in end surface area after 5 weeks of culturing. *p < 0.05, if 0.05 > p < 0.08 then the exact p value is listed in the graph

