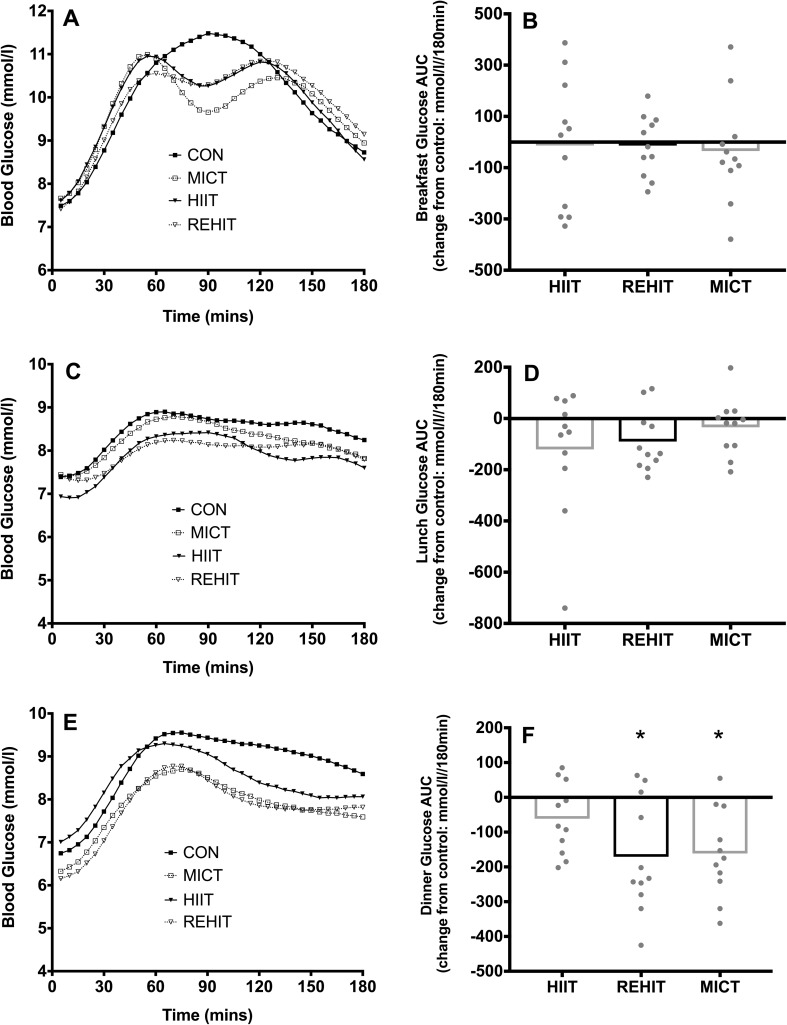
Fig. 4.
Glucose time responses (a, c, e) and AUC (b, d, f) for breakfast (a, b), lunch (c, d) and dinner (e, f). *Denotes p < 0.05 vs CON. Glucose time responses are presented as means only for clarity, whilst AUCs are presented as mean change (bars) with individual change scores (dots) compared with CON

