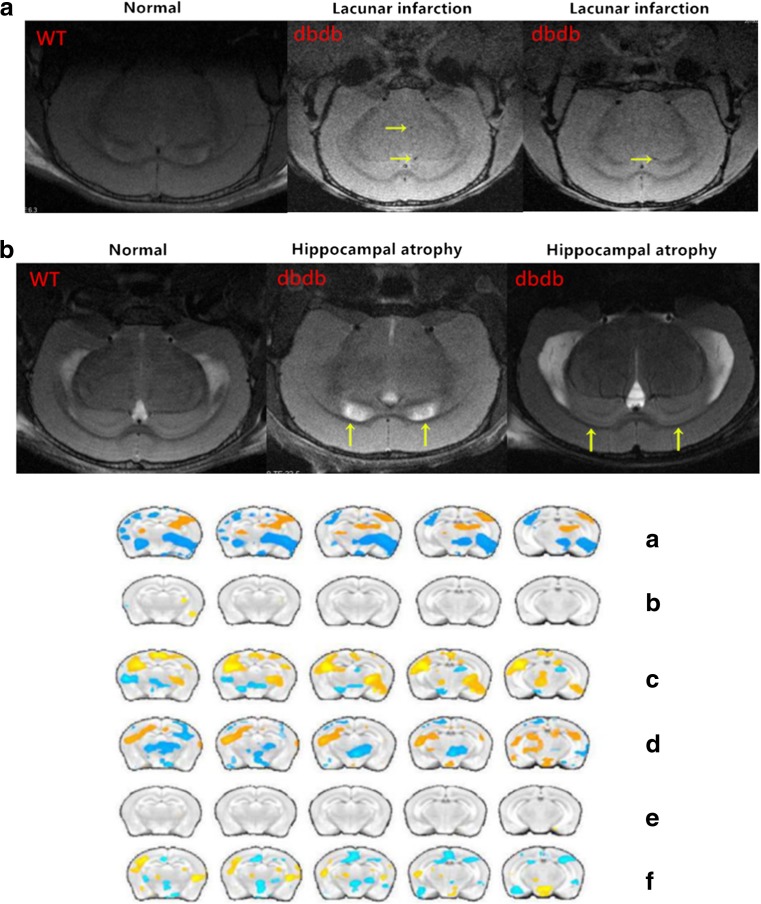
Fig. 4.
The Magnetic resonance images. A: The results showed that cerebral small vessel disease were present in the brains of db/db−/− mice; B:The results showed that hippocampi atrophy and ventricular enlargement were present in the db/db−/− mice. The fMRI-bold results of the mice in each group. A: The ALFF values of the hippocampus of mice in the db/db−/−/WT control groups. B: The ALFF values of the hippocampus of mice in the WT 50 mg/WT control group. C: The ALFF values of the hippocampus of mice in the db/db−/− 50 mg/db/db−/− control group. D: Functional connectivity map of WT control mice and db/db−/− control mice using the hippocampus as the region of interest. E: Functional connectivity map of WT 50 mg mice and WT control mice using the hippocampus as the region of interest. F: Functional connectivity map of db/db−/− 50 mg mice and db/db−/− control mice using the hippocampus as the region of interest. n = 3

