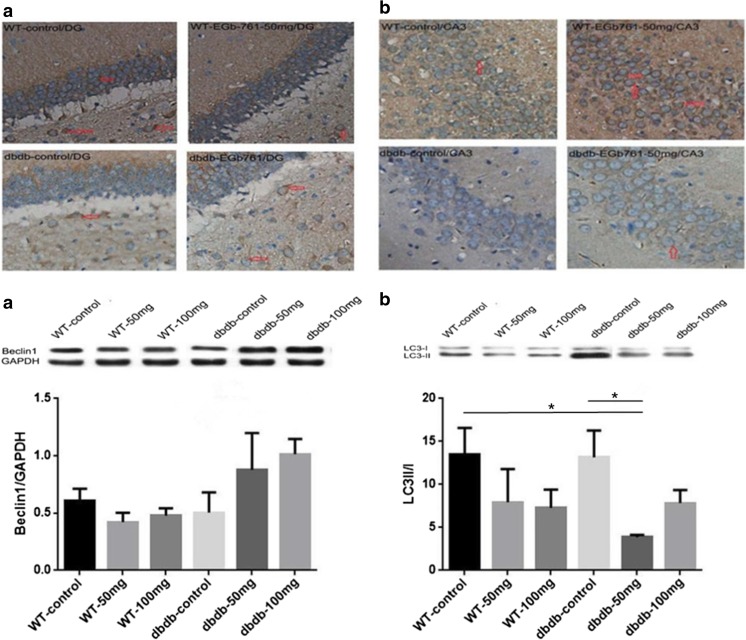
Fig. 5.
Immunohistochemistry staining for LC3 (a) and beclin-1 (b) in the DG and CA3 areas of the hippocampus. A: Representative images of LC3 staining. B: Representative images of beclin-1 staining. Scale bar = 1:20. Beclin-1 and LC3 in levels in the hippocampus were measured by western blotting. The graphs show the relative density of beclin-1 to GAPDH (a) and the LC3-II/I ratio (b). There were trend of growth with beclin-1 expression in the db/db−/− 50 mg and 100 mg group compared with that in the db/db−/− control and three WT groups, but without difference. The LC3-II/I ratio was decreased in the db/db−/− 50 mg and db/db−/− 100 mg groups; the difference of db/db−/− 50 mg group compared with WT control group was significant (*, P < 0.05, F = 3.362); also the difference between db/db−/− 50 mg group and db/db−/− control group was significant (*, P < 0.05, F = 3.362). n = 8 for WT 100 mg and db/db−/− 100 mg; n = 7 for WT 50 mg and db/db−/− control; n = 5 for WT control and db/db−/− 50 mg

