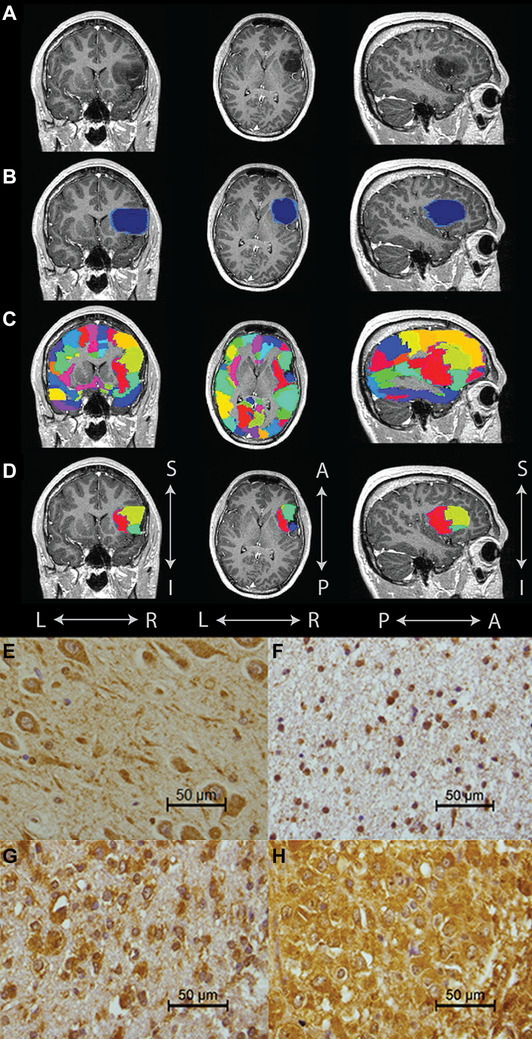
Fig. 1.

Tumor mask, cortical areas and NLGN3 immunohistochemistry. Example of tumor mask, peritumor and global oscillatory activity regions (a–d): a indicates an exemplar T1 weighted scan (post gadolinium) with low-grade glioma in the left frontal region, b depicts the manually segmented tumor mask (dark blue) and peritumor area (light blue), c displays the 78 cortical areas used to calculate global oscillatory brain activity in color, and d contains the atlas regions that fall within the tumor and surrounding tumor area used to calculate peritumor oscillatory brain activity. Examples of tissue expressing neuroligin-3 (e–h): e hippocampus with moderate to strong staining of neuronal cell bodies and their processes, f low NLGN3 expression outside the cell nuclei, g moderate NLGN3 expression especially in tumor cell cytoplasm, and h high NLGN3 expression with strong staining of tumor cells as well as extensive staining of neuropil in between. A anterior, I inferior, L left, NLGN3 neuroligin-3, P posterior, R right, S superior
