Fig. 1.

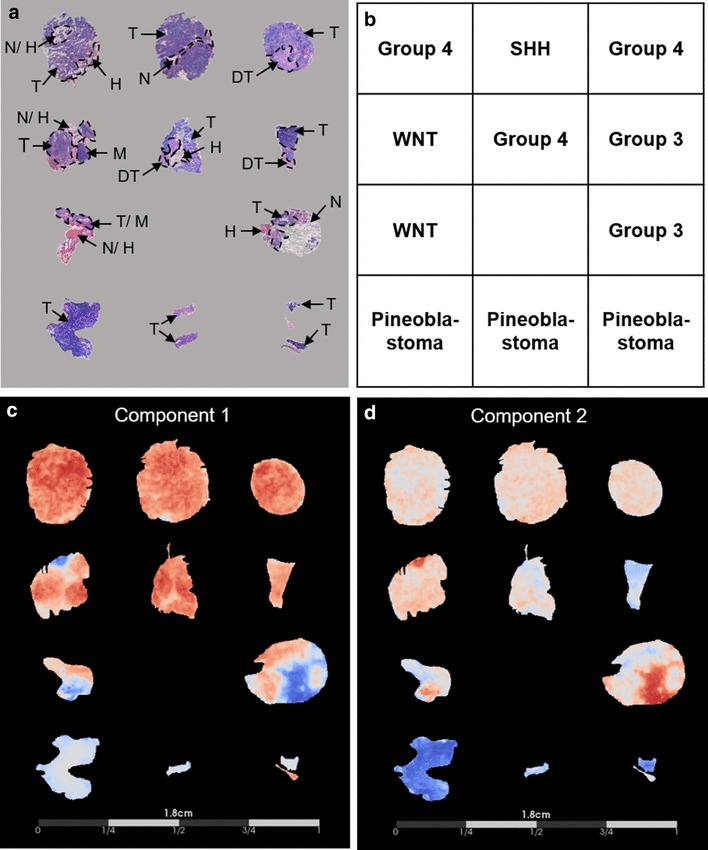
Histological characterization of medulloblastoma and pineoblastoma compared to principal component analysis of the mass spectrometry imaging dataset. a Tissue sections were hematoxylin and eosin stained and optical images at ×40 magnification were assessed to delineate histopathological features, indicated by the dashed lines and arrows, where: tumor (T), differentiated tumor (DT), necrosis (N), hemorrhage (H), and cerebral cortex molecular layer (M). b Layout of specimens. c, d Display of the PCA results using a cool-to-warm intensity heat map for which the gradient blue-white-red represents negative-to-positive degrees of variance for the separate components. Component 1 (c), representative of the greatest variance of the MSI dataset, distinguished medulloblastoma from pineoblastoma as indicated by the overall abundance of red and blue present in the medulloblastoma specimens compared to white present in the pineoblastoma specimens. Component 2 (d), representative of the second greatest variance of the MSI dataset, also distinguished medulloblastoma from pineoblastoma observed by the overall red-white present in the medulloblastoma specimens compared to the blue gradient present in pineoblastoma
