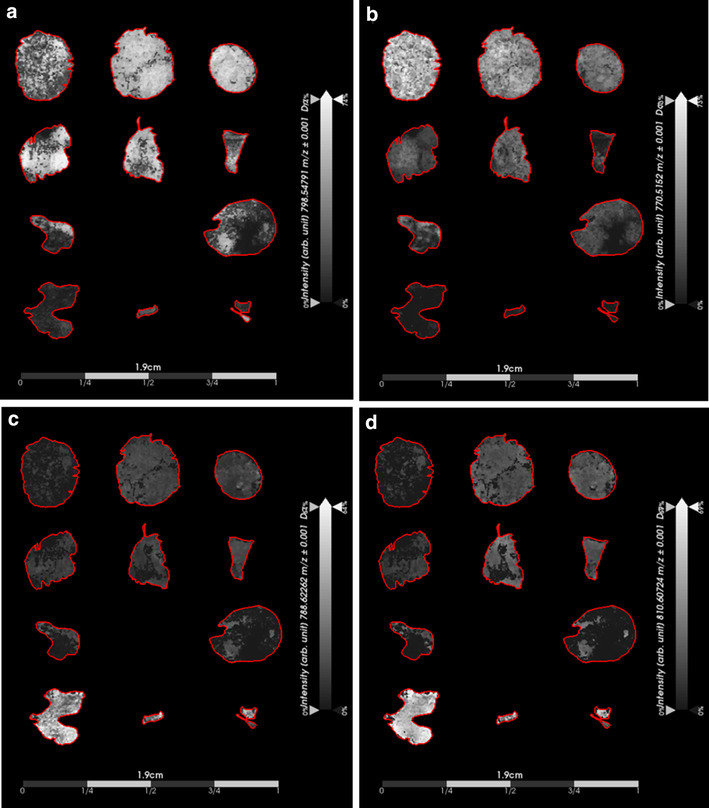
Fig. 2.

Single ion images generated from ions identified by principal component analysis (PCA) of the mass spectral imaging (MSI) dataset. Results demonstrate the capability of using potential biomarkers to discriminate between medulloblastoma and pineoblastoma tumor types. Important to note that the ion intensity scales were adjusted relative to each individual ion intensity. a Displays intensity of an ion detected at m/z 798.5479 that was detected with higher intensity in all subgroups of medulloblastoma when compared to pineoblastoma. b Displays the intensity of an additional ion (m/z 770.5152) that was detected with higher intensity in all subgroups of medulloblastoma when compared to pineoblastoma. c and d Displays intensities of two ions detected with higher intensity in pineoblastoma when compared to medulloblastoma with m/z of 788.6226 and m/z 810.6072, respectively
