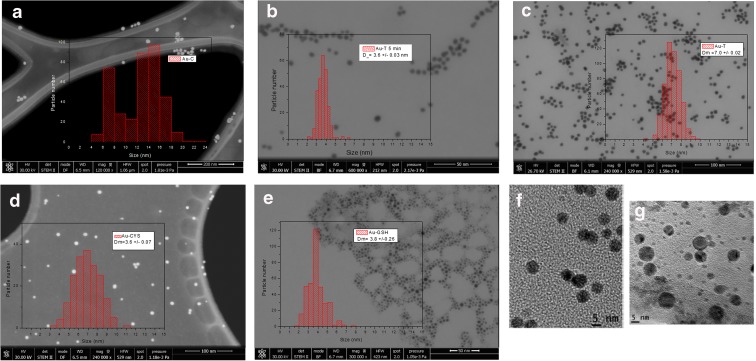
Fig. 2.
TEM micrographs obtained from different Au NP capping agents: a Au-C, b Au-TC after 5 min of synthesis, c Au-TC after 45 min of synthesis, d Au-CYS, e Au-GSH. Corresponding histograms displaying particle size distribution are shown in the right panels: f and g are high-resolution images for Au-TC and Au-CYS, respectively

